

Question: Please show all working out by hand and NOT excel. thank you The data in the following table give quarterly sales yt(t=1,2,,16) of a product
Please show all working out by hand and NOT excel. thank you
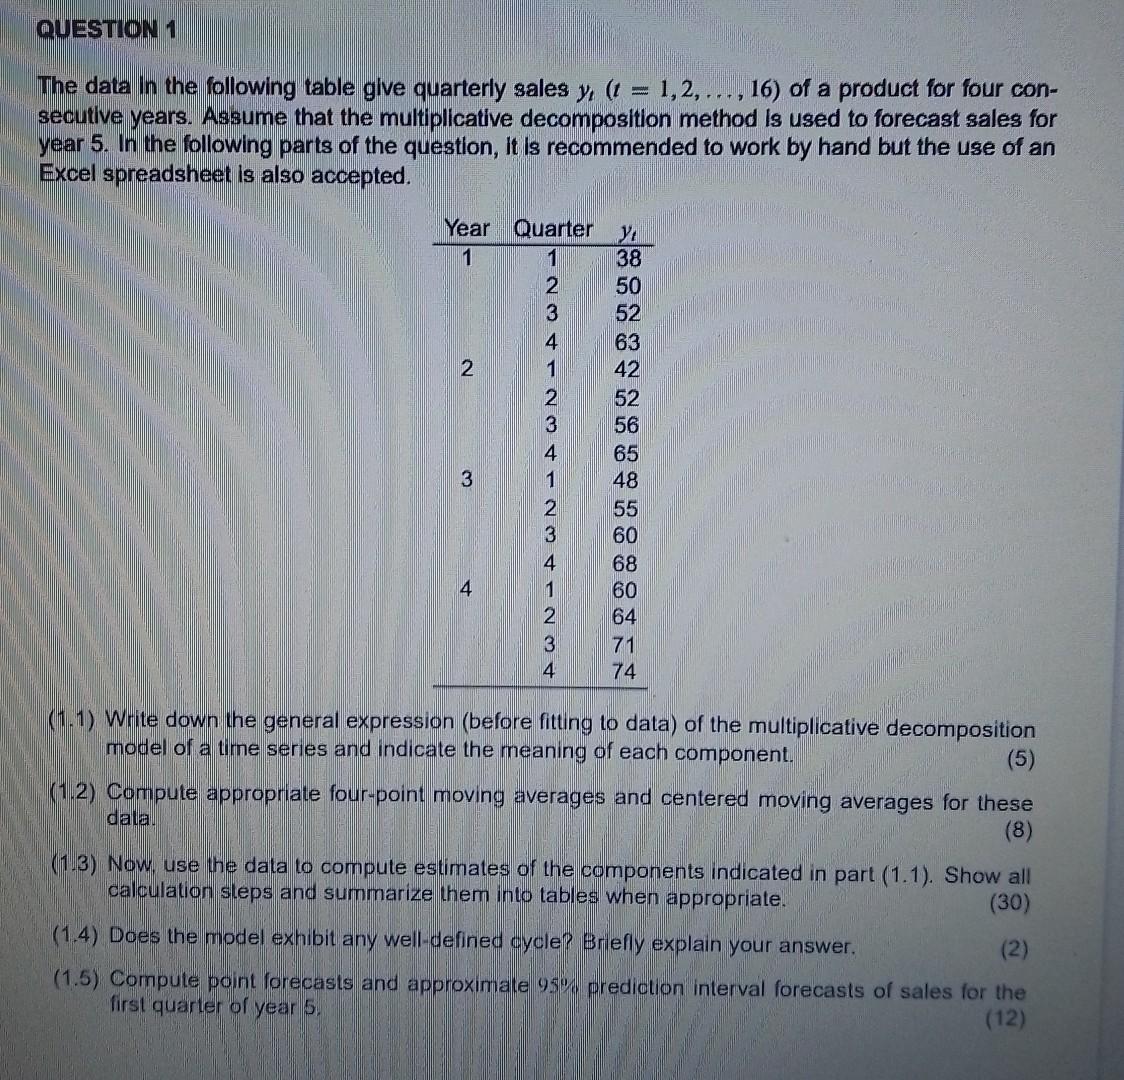
The data in the following table give quarterly sales yt(t=1,2,,16) of a product for four consecutive years. Assume that the multiplicative decomposition method is used to forecast sales for year 5. In the following parts of the question, it is recommended to work by hand but the use of an Excel spreadsheet is also accepted. (1.1) Write down the general expression (before fitting to data) of the multiplicative decomposition model of a time series and indicate the meaning of each component. (1.2) Compute appropriate four-point moving averages and centered moving averages for these data. (1.3) Now, use the data to compute estimates of the components indicated in part (1.1). Show all calculation steps and summarize them into tables when appropriate. (1.4) Does the model exhibit any well-defined cycle? Briefly explain your answer. (1.5) Compute point forecasts and approximate 95% prediction interval forecasts of sales for the first quarter of year 5 . The data in the following table give quarterly sales yt(t=1,2,,16) of a product for four consecutive years. Assume that the multiplicative decomposition method is used to forecast sales for year 5. In the following parts of the question, it is recommended to work by hand but the use of an Excel spreadsheet is also accepted. (1.1) Write down the general expression (before fitting to data) of the multiplicative decomposition model of a time series and indicate the meaning of each component. (1.2) Compute appropriate four-point moving averages and centered moving averages for these data. (1.3) Now, use the data to compute estimates of the components indicated in part (1.1). Show all calculation steps and summarize them into tables when appropriate. (1.4) Does the model exhibit any well-defined cycle? Briefly explain your answer. (1.5) Compute point forecasts and approximate 95% prediction interval forecasts of sales for the first quarter of year 5
Step by Step Solution
There are 3 Steps involved in it

Get step-by-step solutions from verified subject matter experts