

Question: PLEASE SHOW ALL WORKINGS, FROM EXCEL TO GRAPHS, STEP BY STEP A quality control inspector working at a soft drink company has taken 1 0
PLEASE SHOW ALL WORKINGS, FROM EXCEL TO GRAPHS,
STEP BY STEP
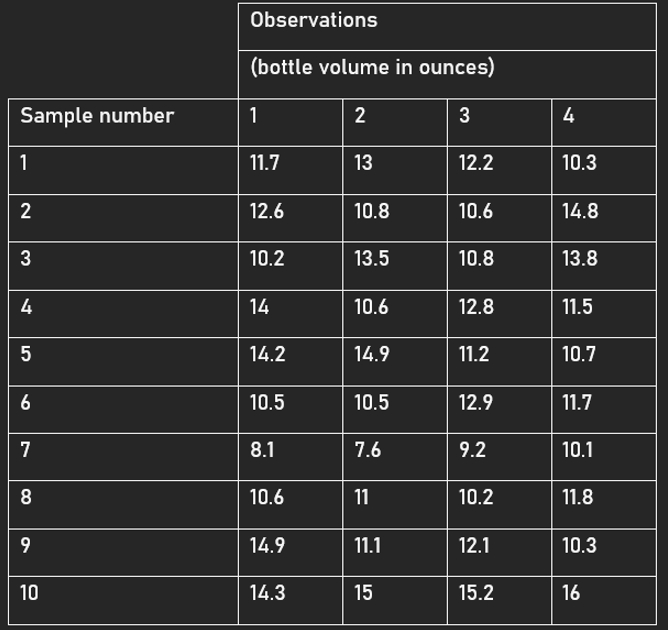
A quality control inspector working at a soft drink company has taken samples, with observations each, of the volume of bottles filled. The standard deviation of the bottling operation is unknown. The task is to develop control limits of standard deviations for the bottling operations based on this information. To do so draw an Xbar chart and an Rchart using a ruler and a pencil. Name the horizontal and vertical axes, and mark the centerline, UCL, and LCL on your diagram. Show the calculations for xbars of all samples, ranges of all samples, and the formula for UCL, LCL and their calculations.
Explain the process performance in detail. Use the concepts addressed in the uploaded pdf file Control Chart Rules and Interpretation BPI Consulting
Step by Step Solution
There are 3 Steps involved in it
1 Expert Approved Answer
Step: 1 Unlock

Question Has Been Solved by an Expert!
Get step-by-step solutions from verified subject matter experts
Step: 2 Unlock
Step: 3 Unlock