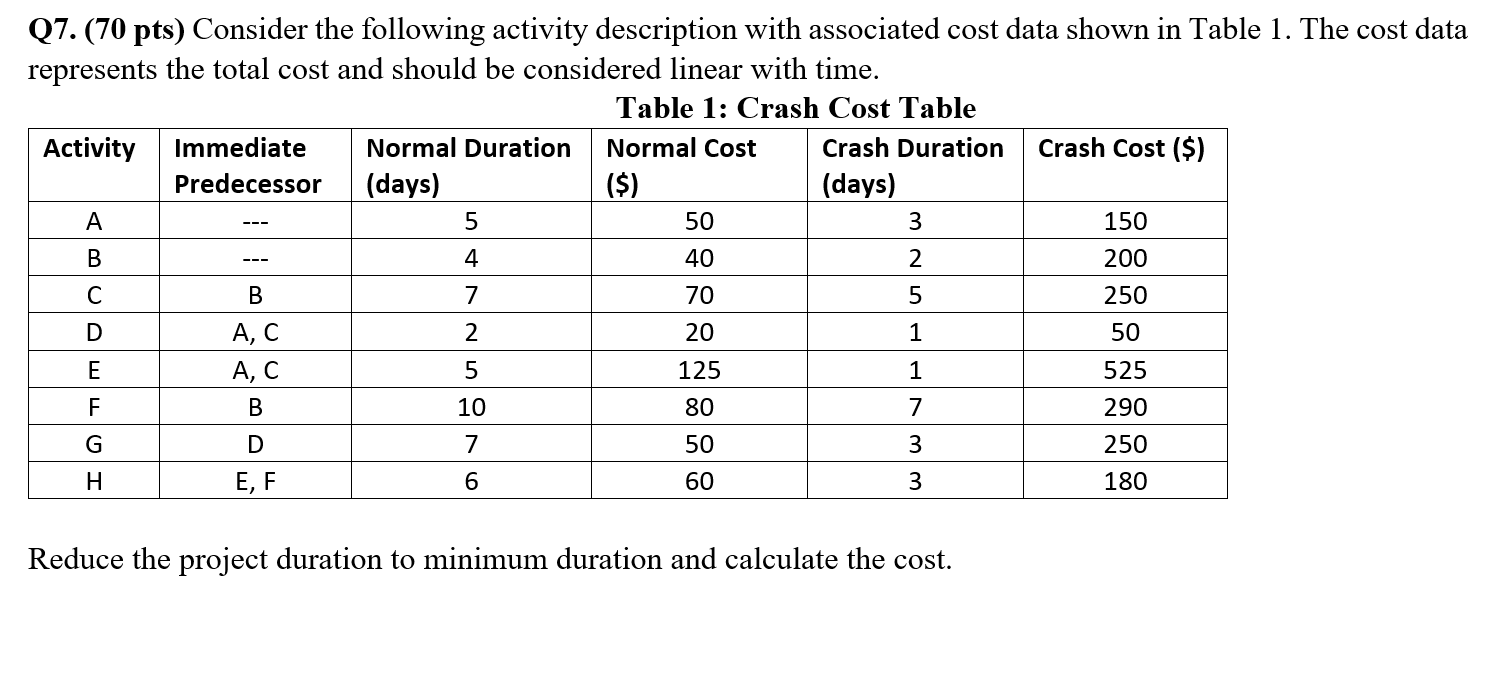
Question: Please show all your work. 5 3 Q7.(70 pts) Consider the following activity description with associated cost data shown in Table 1. The cost data

Please show all your work. 5 3 Q7.(70 pts)Please show all your work.

5 3 Q7.(70 pts) Consider the following activity description with associated cost data shown in Table 1. The cost data represents the total cost and should be considered linear with time. Table 1: Crash Cost Table Activity Immediate Normal Duration Normal Cost Crash Duration Crash Cost ($) Predecessor (days) ($) (days) A 50 150 B 40 2 200 C B 7 70 5 250 AC 2 20 1 50 E A, C 5 125 1 525 F B 10 80 7 290 D 7 50 250 E, F 6 60 3 180 4 D G 3 Reduce the project duration to minimum duration and calculate the cost

Step by Step Solution

There are 3 Steps involved in it

1 Expert Approved Answer
Step: 1 Unlock blur-text-image
Question Has Been Solved by an Expert!

Get step-by-step solutions from verified subject matter experts

Step: 2 Unlock
Step: 3 Unlock

Students Have Also Explored These Related General Management Questions!