

Question: Please show all your work for the question to help me better understand and be able to complete problems similar to this in the future.
Please show all your work for the question to help me better understand and be able to complete problems similar to this in the future. I will be posting the background information in the chat. Thank you and I will be rating highly!
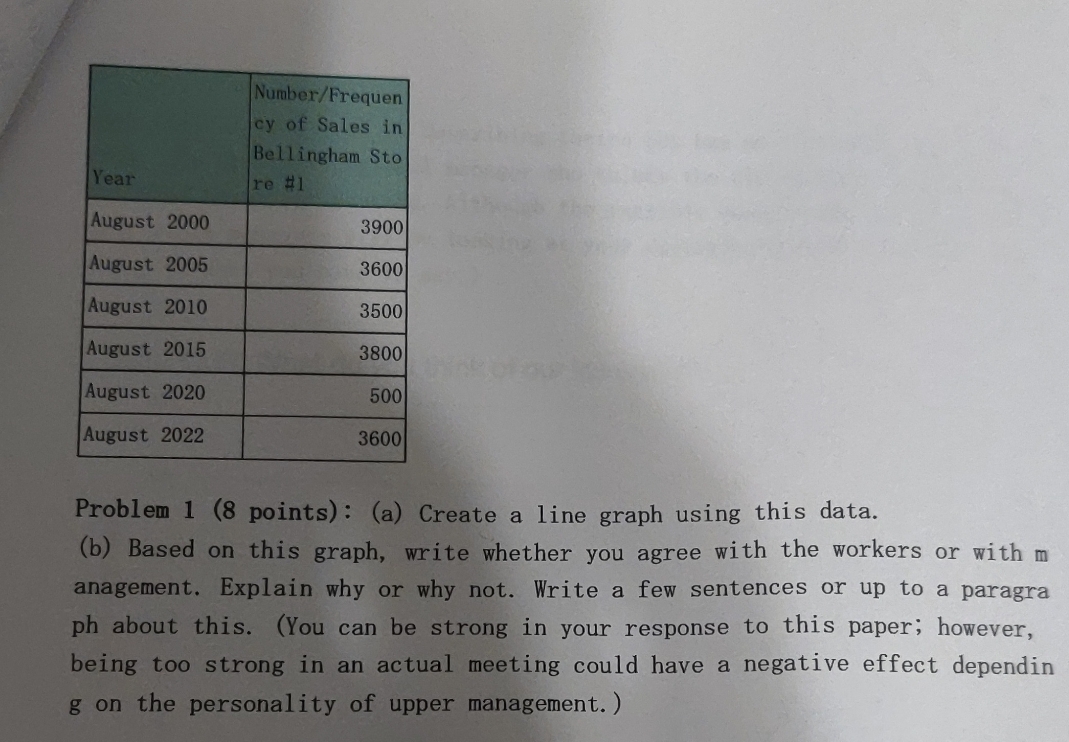
Number/Frequen cy of Sales in Bellingham Sto Year re #1 August 2000 3900 August 2005 3600 August 2010 3500 August 2015 3800 August 2020 500 August 2022 3600 Problem 1 (8 points) : (a) Create a line graph using this data. (b) Based on this graph, write whether you agree with the workers or with m anagement. Explain why or why not. Write a few sentences or up to a paragra ph about this. (You can be strong in your response to this paper; however, being too strong in an actual meeting could have a negative effect dependin g on the personality of upper management. )
Step by Step Solution
There are 3 Steps involved in it

Get step-by-step solutions from verified subject matter experts