

Question: Please show any excel formula that explains the solution if applicable Part 2: Bear Spread C) Consider selling a put option with a strike of
Please show any excel formula that explains the solution if applicable
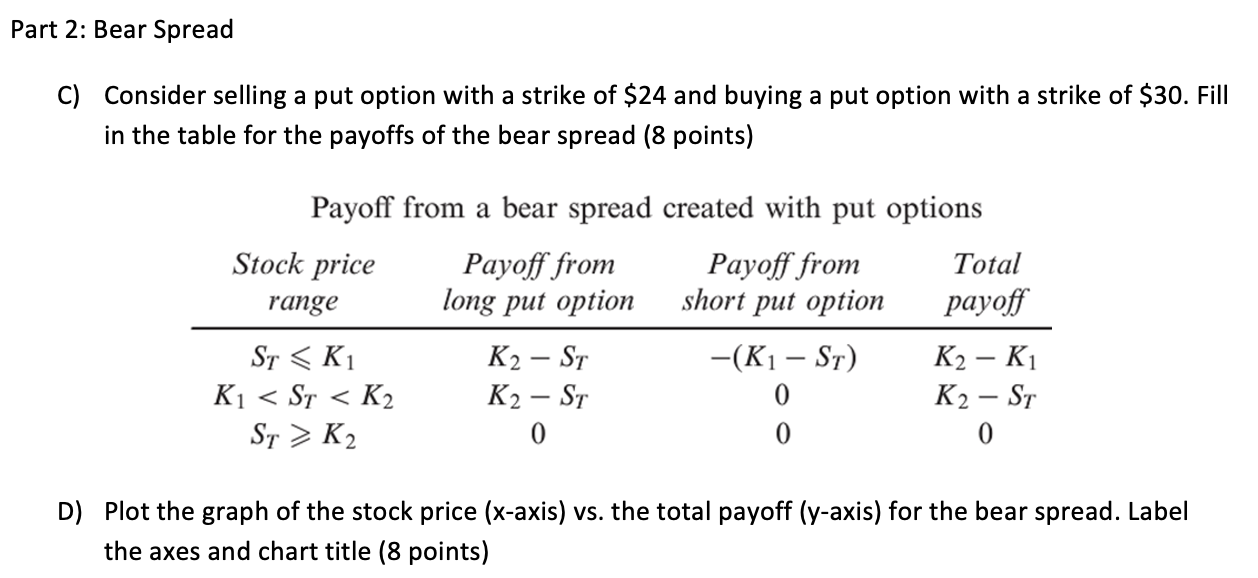
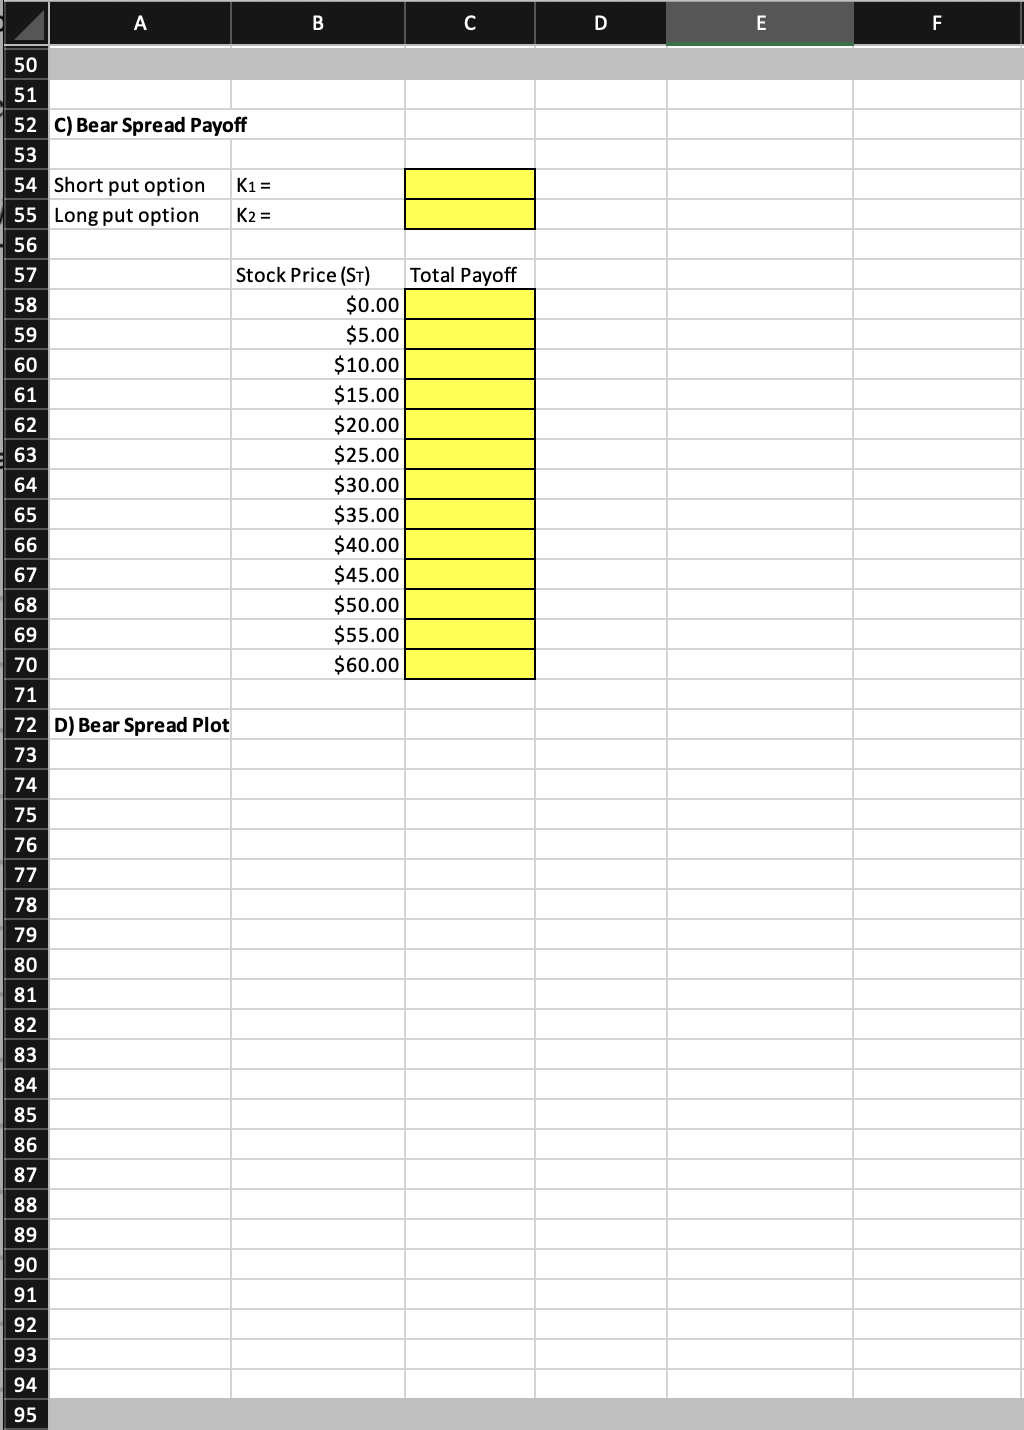
Part 2: Bear Spread C) Consider selling a put option with a strike of $24 and buying a put option with a strike of $30. Fill in the table for the payoffs of the bear spread (8 points) Payoff from a bear spread created with put options Stock price Payoff from Payoff from Total range long put option short put option payoff ST K2 0 0 0 D) Plot the graph of the stock price (x-axis) vs. the total payoff (y-axis) for the bear spread. Label the axes and chart title (8 points) A B C D E F 50 51 52 c) Bear Spread Payoff 53 54 Short put option K1 = 55 Long put option K2 = 56 57 Stock Price (ST) Total Payoff 58 $0.00 59 $5.00 60 $10.00 61 $15.00 62 $20.00 63 $25.00 64 $30.00 65 $35.00 66 $40.00 67 $45.00 68 $50.00 69 $55.00 70 $60.00 71 72 D) Bear Spread Plot 73 74 75 76 77 78 79 80 81 82 83 84 85 86 87 88 89 90 91 92 93 94 95
Step by Step Solution
There are 3 Steps involved in it

Get step-by-step solutions from verified subject matter experts