

Question: Please Show code for MATLAB and use comments if possible. Thank you b)Fourier Analysis in Simulink or a periodic input, the spectrum should approximate the
Please Show code for MATLAB and use comments if possible. Thank you
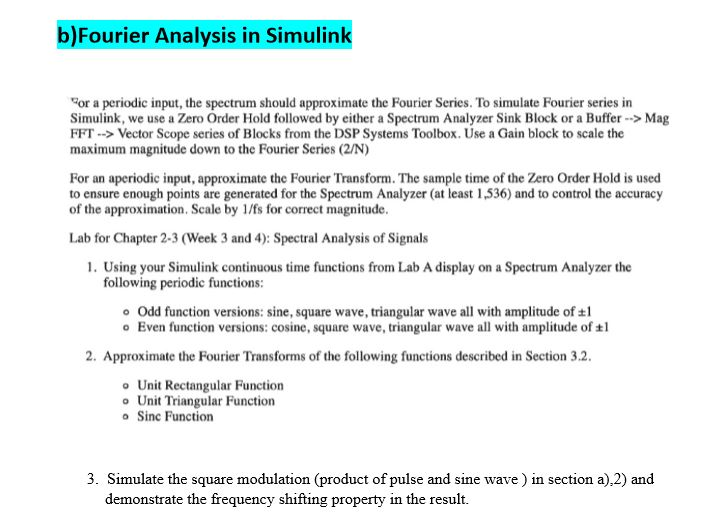
b)Fourier Analysis in Simulink or a periodic input, the spectrum should approximate the Fourier Series. To simulate Fourier series in Simulink, we use a Zero Order Hold followed by either a Spectrum Analyzer Sink Block or a Buffer >Mag FFT->Vector Scope series of Blocks from the DSP Systems Toolbox. Use a Gain block to scale the maximum magnitude down to the Fourier Series (2/N) For an aperiodic input, approximate the Fourier Transform. The sample time of the Zero Order Hold is used to ensure enough points are generated for the Spectrum Analyzer (at least 1,536) and to control the accuracy of the approximation. Scale by 1/fs for correct magnitude Lab for Chapter 2-3 (Week 3 and 4): Spectral Analysis of Signals 1. Using your Simulink continuous time functions from Lab A display on a Spectrum Analyzer the following periodic functions: o Odd function versions: sine, square wave, triangular wave all with amplitude of tl o Even function versions: cosine, square wave, triangular wave all with amplitude of tl 2. Approximate the Fourier Transforms of the following functions described in Section 3.2 o Unit Rectangular Function o Unit Triangular Function o Sinc Function 3. Simulate the square modulation (product of pulse and sine wave) in section a),2) and demonstrate the frequency shifting property in the result. b)Fourier Analysis in Simulink or a periodic input, the spectrum should approximate the Fourier Series. To simulate Fourier series in Simulink, we use a Zero Order Hold followed by either a Spectrum Analyzer Sink Block or a Buffer >Mag FFT->Vector Scope series of Blocks from the DSP Systems Toolbox. Use a Gain block to scale the maximum magnitude down to the Fourier Series (2/N) For an aperiodic input, approximate the Fourier Transform. The sample time of the Zero Order Hold is used to ensure enough points are generated for the Spectrum Analyzer (at least 1,536) and to control the accuracy of the approximation. Scale by 1/fs for correct magnitude Lab for Chapter 2-3 (Week 3 and 4): Spectral Analysis of Signals 1. Using your Simulink continuous time functions from Lab A display on a Spectrum Analyzer the following periodic functions: o Odd function versions: sine, square wave, triangular wave all with amplitude of tl o Even function versions: cosine, square wave, triangular wave all with amplitude of tl 2. Approximate the Fourier Transforms of the following functions described in Section 3.2 o Unit Rectangular Function o Unit Triangular Function o Sinc Function 3. Simulate the square modulation (product of pulse and sine wave) in section a),2) and demonstrate the frequency shifting property in the result
Step by Step Solution
There are 3 Steps involved in it

Get step-by-step solutions from verified subject matter experts