

Question: please show COMPLETE SOLUTIONS and with label. The following data represents the sample score of 30 students in a diagnostic test. Class Limits Frequency 40
please show COMPLETE SOLUTIONS and with label.
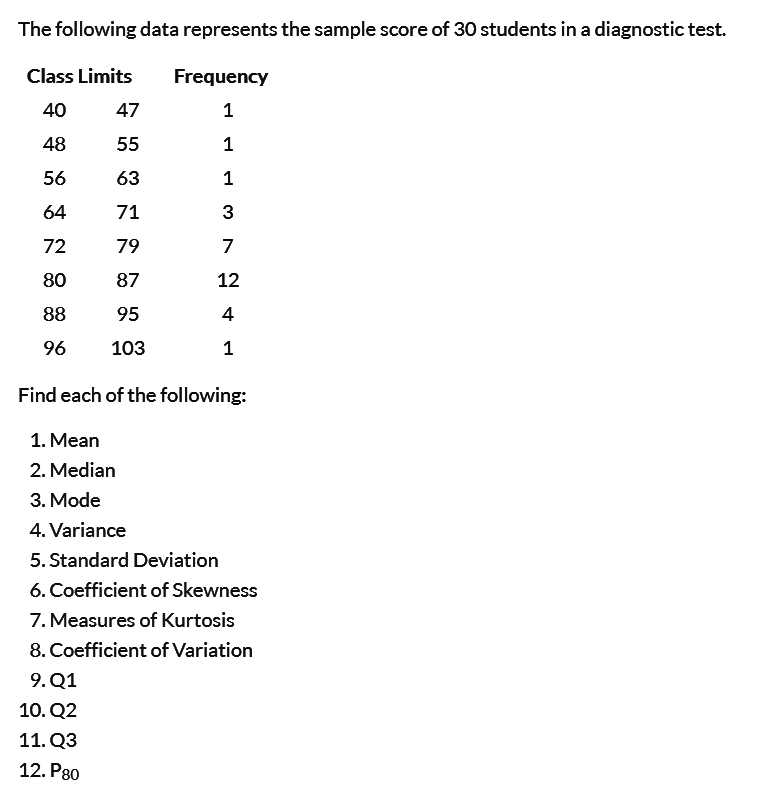
The following data represents the sample score of 30 students in a diagnostic test. Class Limits Frequency 40 47 48 55 56 63 64 71 3 72 79 7 80 87 12 88 95 4 96 103 Find each of the following: 1. Mean 2. Median 3. Mode 4. Variance 5. Standard Deviation 6. Coefficient of Skewness 7. Measures of Kurtosis 8. Coefficient of Variation 9. Q1 10. Q2 11. Q3 12. P80
Step by Step Solution
There are 3 Steps involved in it
1 Expert Approved Answer
Step: 1 Unlock

Question Has Been Solved by an Expert!
Get step-by-step solutions from verified subject matter experts
Step: 2 Unlock
Step: 3 Unlock