

Question: please show excel formats please! thank you so much! really need help! been struggling! c. Now conduct a scenario analysis. Assume that there is a
please show excel formats please! thank you so much! really need help! been struggling!
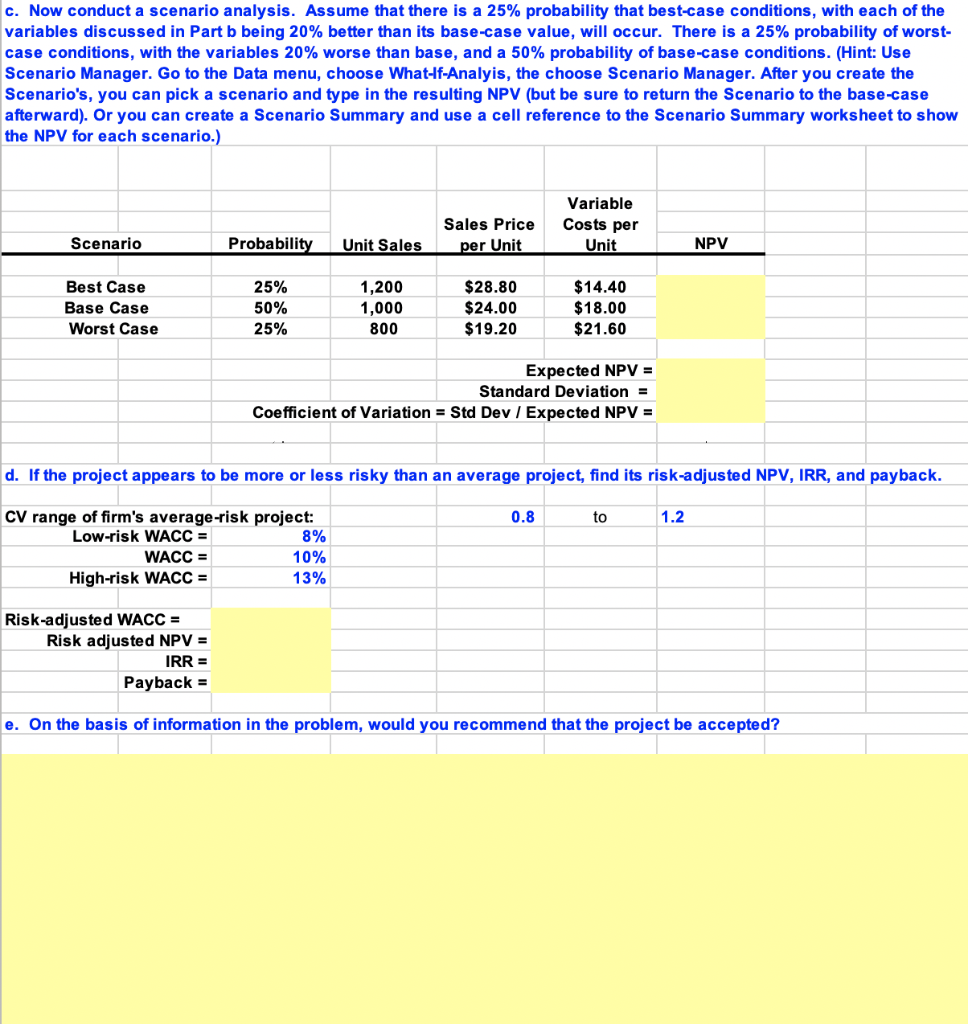
c. Now conduct a scenario analysis. Assume that there is a 25% probability that best-case conditions, with each of the variables discussed in Part b being 20% better than its base-case value, will occur. There is a 25% probability of worst- case conditions, with the variables 20% worse than base, and a 50% probability of base-case conditions. (Hint: Use Scenario Manager. Go to the Data menu, choose What-If-Analyis, the choose Scenario Manager. After you create the Scenario's, you can pick a scenario and type in the resulting NPV (but be sure to return the Scenario to the base-case afterward). Or you can create a Scenario Summary and use a cell reference to the Scenario Summary worksheet to show the NPV for each scenario.) Variable Costs per Unit Sales Price per Unit Scenario Probability Unit Sales NPV Best Case Base Case Worst Case 25% 50% 25% 1,200 1,000 800 $28.80 $24.00 $19.20 $14.40 $18.00 $21.60 Expected NPV = Standard Deviation = Coefficient of Variation = Std Dev / Expected NPV = d. If the project appears to be more or less risky than an average project, find its risk-adjusted NPV, IRR, and payback. 0.8 to 1.2 CV range of firm's average-risk project: Low-risk WACC = 8% WACC = 10% High-risk WACC = 13% Risk-adjusted WACC = Risk adjusted NPV = IRR = Payback = e. On the basis of information in the problem, would you recommend that the project be accepted? c. Now conduct a scenario analysis. Assume that there is a 25% probability that best-case conditions, with each of the variables discussed in Part b being 20% better than its base-case value, will occur. There is a 25% probability of worst- case conditions, with the variables 20% worse than base, and a 50% probability of base-case conditions. (Hint: Use Scenario Manager. Go to the Data menu, choose What-If-Analyis, the choose Scenario Manager. After you create the Scenario's, you can pick a scenario and type in the resulting NPV (but be sure to return the Scenario to the base-case afterward). Or you can create a Scenario Summary and use a cell reference to the Scenario Summary worksheet to show the NPV for each scenario.) Variable Costs per Unit Sales Price per Unit Scenario Probability Unit Sales NPV Best Case Base Case Worst Case 25% 50% 25% 1,200 1,000 800 $28.80 $24.00 $19.20 $14.40 $18.00 $21.60 Expected NPV = Standard Deviation = Coefficient of Variation = Std Dev / Expected NPV = d. If the project appears to be more or less risky than an average project, find its risk-adjusted NPV, IRR, and payback. 0.8 to 1.2 CV range of firm's average-risk project: Low-risk WACC = 8% WACC = 10% High-risk WACC = 13% Risk-adjusted WACC = Risk adjusted NPV = IRR = Payback = e. On the basis of information in the problem, would you recommend that the project be accepted
Step by Step Solution
There are 3 Steps involved in it

Get step-by-step solutions from verified subject matter experts