

Question: Please show excel formulas for all calculations More info on case can be found here https://www.chegg.com/homework-help/questions-and-answers/atlantic-corporation-abridged-royal-paper-corporation-respectively-met-lunch-discuss-possi-q53882234 Exhibit 3 I. Bond Yields, as of April 9,
Please show excel formulas for all calculations
More info on case can be found here
https://www.chegg.com/homework-help/questions-and-answers/atlantic-corporation-abridged-royal-paper-corporation-respectively-met-lunch-discuss-possi-q53882234
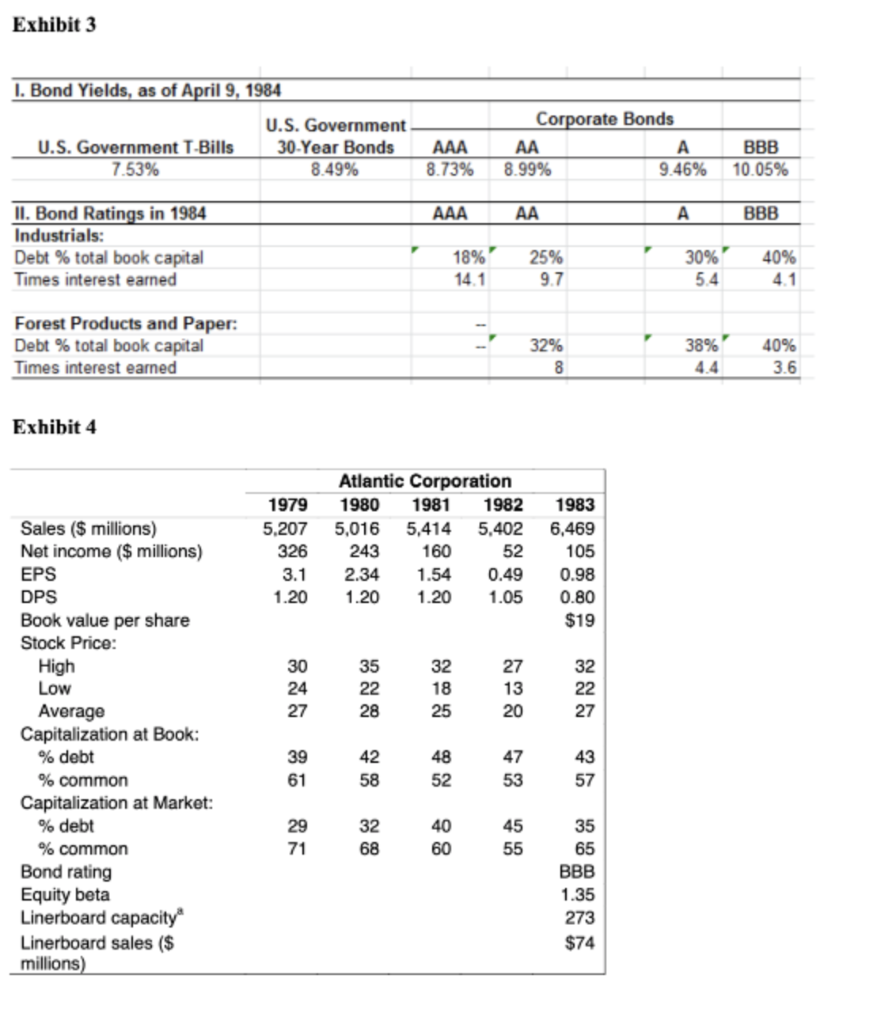
Exhibit 3 I. Bond Yields, as of April 9, 1984 U.S. Government U.S. Government T-Bills 30-Year Bonds 7.53% 8.49% AAA 8.73% Corporate Bonds AA A 8.99% 9.46% BBB 10.05% AAA AA BBB II. Bond Ratings in 1984 Industrials: Debt % total book capital Times interest earned 18%' 25% 9.7 30% 5.4 40% 4.1 14.1 Forest Products and Paper: Debt % total book capital Times interest earned 32% 8 38% 4.4 40% 3.6 Exhibit 4 1979 5,207 326 3.1 1.20 Atlantic Corporation 1980 1981 1982 5,016 5,414 5,402 243 160 52 2.34 1.54 0.49 1.20 1.20 1.05 1983 6,469 105 0.98 0.80 $19 30 24 27 35 22 28 32 18 25 27 13 20 32 22 27 Sales ($ millions) Net income ($ millions) EPS DPS Book value per share Stock Price: High Low Average Capitalization at Book: % debt % common Capitalization at Market: % debt % common Bond rating Equity beta Linerboard capacity Linerboard sales ($ millions) 39 61 42 58 48 52 47 53 43 57 29 71 32 68 40 60 45 55 35 65 BBB 1.35 273 $74 Exhibit 3 I. Bond Yields, as of April 9, 1984 U.S. Government U.S. Government T-Bills 30-Year Bonds 7.53% 8.49% AAA 8.73% Corporate Bonds AA A 8.99% 9.46% BBB 10.05% AAA AA BBB II. Bond Ratings in 1984 Industrials: Debt % total book capital Times interest earned 18%' 25% 9.7 30% 5.4 40% 4.1 14.1 Forest Products and Paper: Debt % total book capital Times interest earned 32% 8 38% 4.4 40% 3.6 Exhibit 4 1979 5,207 326 3.1 1.20 Atlantic Corporation 1980 1981 1982 5,016 5,414 5,402 243 160 52 2.34 1.54 0.49 1.20 1.20 1.05 1983 6,469 105 0.98 0.80 $19 30 24 27 35 22 28 32 18 25 27 13 20 32 22 27 Sales ($ millions) Net income ($ millions) EPS DPS Book value per share Stock Price: High Low Average Capitalization at Book: % debt % common Capitalization at Market: % debt % common Bond rating Equity beta Linerboard capacity Linerboard sales ($ millions) 39 61 42 58 48 52 47 53 43 57 29 71 32 68 40 60 45 55 35 65 BBB 1.35 273 $74
Step by Step Solution
There are 3 Steps involved in it

Get step-by-step solutions from verified subject matter experts