

Question: please show excel formulas used 2 10 11 12 13 14 15 16 17 18 19 20 21 22 23 24 A B U D
please show excel formulas used 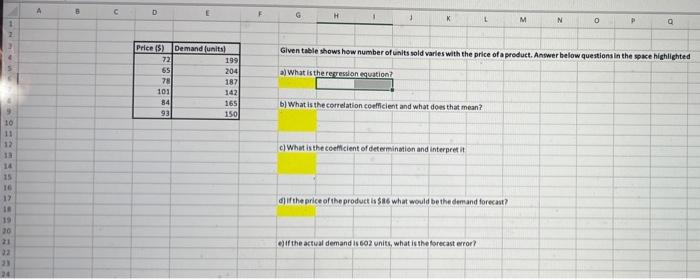
2 10 11 12 13 14 15 16 17 18 19 20 21 22 23 24 A B U D Price (5) 72 65 78 101 84 93 Demand (units) 199 204 187 142 165 150 F G H J L M N 0 P Q Given table shows how number of units sold varies with the price of a product. Answer below questions in the space highlighted a) What is the regression equation? b) What is the correlation coefficient and what does that mean? c) What is the coefficient of determination and interpret it d) If the price of the product is $86 what would be the demand forecast? e) If the actual demand is 602 units, what is the forecast error
Step by Step Solution
There are 3 Steps involved in it
1 Expert Approved Answer
Step: 1 Unlock

Question Has Been Solved by an Expert!
Get step-by-step solutions from verified subject matter experts
Step: 2 Unlock
Step: 3 Unlock