

Question: please show excel sheet with formulas 2. The Famous Markowitz Portfolio Problem (25 points) Reconsider problem 3 in the Unit 6HW. =[2A2+2B2+2C2+2covarianceAB+2covarianceAC+2covarianceBC].5 Hint: See Unit
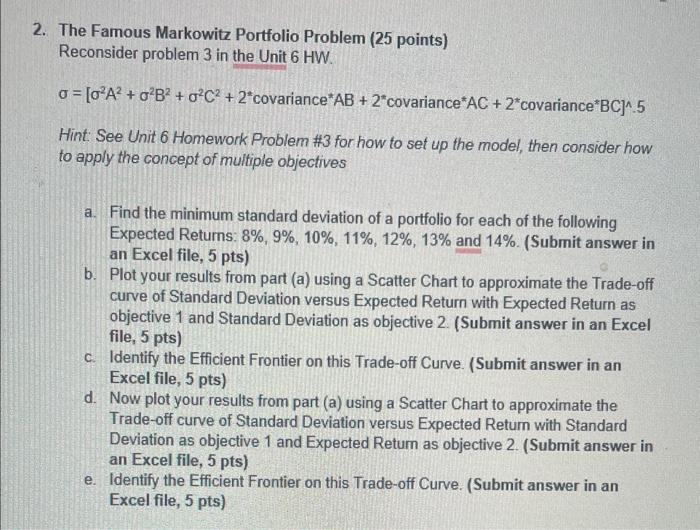
2. The Famous Markowitz Portfolio Problem (25 points) Reconsider problem 3 in the Unit 6HW. =[2A2+2B2+2C2+2covarianceAB+2covarianceAC+2covarianceBC].5 Hint: See Unit 6 Homework Problem \#3 for how to set up the model, then consider how to apply the concept of multiple objectives a. Find the minimum standard deviation of a portfolio for each of the following Expected Returns: 8%,9%,10%,11%,12%,13% and 14%. (Submit answer in an Excel file, 5pts ) b. Plot your results from part (a) using a Scatter Chart to approximate the Trade-off curve of Standard Deviation versus Expected Return with Expected Return as objective 1 and Standard Deviation as objective 2. (Submit answer in an Excel file, 5pts) c. Identify the Efficient Frontier on this Trade-off Curve. (Submit answer in an Excel file, 5 pts) d. Now plot your results from part (a) using a Scatter Chart to approximate the Trade-off curve of Standard Deviation versus Expected Return with Standard Deviation as objective 1 and Expected Return as objective 2. (Submit answer in an Excel file, 5pts ) e. Identify the Efficient Frontier on this Trade-off Curve. (Submit answer in an Excel file, 5 pts) 2. The Famous Markowitz Portfolio Problem (25 points) Reconsider problem 3 in the Unit 6HW. =[2A2+2B2+2C2+2covarianceAB+2covarianceAC+2covarianceBC].5 Hint: See Unit 6 Homework Problem \#3 for how to set up the model, then consider how to apply the concept of multiple objectives a. Find the minimum standard deviation of a portfolio for each of the following Expected Returns: 8%,9%,10%,11%,12%,13% and 14%. (Submit answer in an Excel file, 5pts ) b. Plot your results from part (a) using a Scatter Chart to approximate the Trade-off curve of Standard Deviation versus Expected Return with Expected Return as objective 1 and Standard Deviation as objective 2. (Submit answer in an Excel file, 5pts) c. Identify the Efficient Frontier on this Trade-off Curve. (Submit answer in an Excel file, 5 pts) d. Now plot your results from part (a) using a Scatter Chart to approximate the Trade-off curve of Standard Deviation versus Expected Return with Standard Deviation as objective 1 and Expected Return as objective 2. (Submit answer in an Excel file, 5pts ) e. Identify the Efficient Frontier on this Trade-off Curve. (Submit answer in an Excel file, 5 pts)
Step by Step Solution
There are 3 Steps involved in it

Get step-by-step solutions from verified subject matter experts