Question: please show excel work Problem 1.5 Freight Cars Freight car loading over an 18 week period at a busy port are as follows. Week Leadings

please show excel work please show excel work Problem 1.5 Freight Cars
Problem 1.5 Freight Cars Freight car loading over an 18 week period at a busy port are as follows. Week Leadings Graph Loudings (Y) vs Woeks (X) 112 y 220 Forecast 227.16 245 246.12 3 280 265.08 4 275 5 300 284,04 303.00 321,96 6 7 140.92 8 359.88 378.84 9 10 397,80 11 310 350 360 400 380) 420 450 460 475 500 S10 416,76 435.72 12 13 454,68 473,64 IS 492.60 511.56 16 17 525 $30.52 F-bt 18 541 549,48 SUM b=n SUM(TV)-SUMOSUMY)= SUM(+2) ASUMOV 2 a-SUMIY)- 5 SUM- a Determine the trend line equation and show the graph b. Determe the forecast for weeks 20 and 21 6. The manager intends to install new equipment when the volume exceeds 800 loadings per week. When will this happen

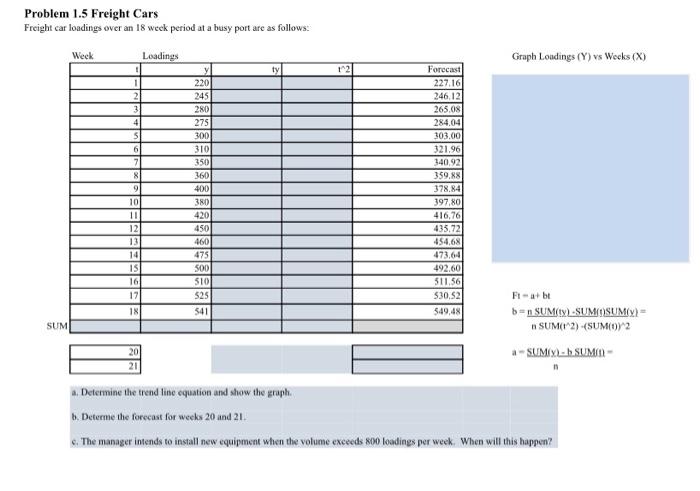
Step by Step Solution

There are 3 Steps involved in it

1 Expert Approved Answer
Step: 1 Unlock blur-text-image
Question Has Been Solved by an Expert!

Get step-by-step solutions from verified subject matter experts

Step: 2 Unlock
Step: 3 Unlock

Students Have Also Explored These Related General Management Questions!