

Question: Please show formula and steps for question 3 The table to the left is a simulation of the monthly returns for seven different assets over
 Please show formula and steps for question 3
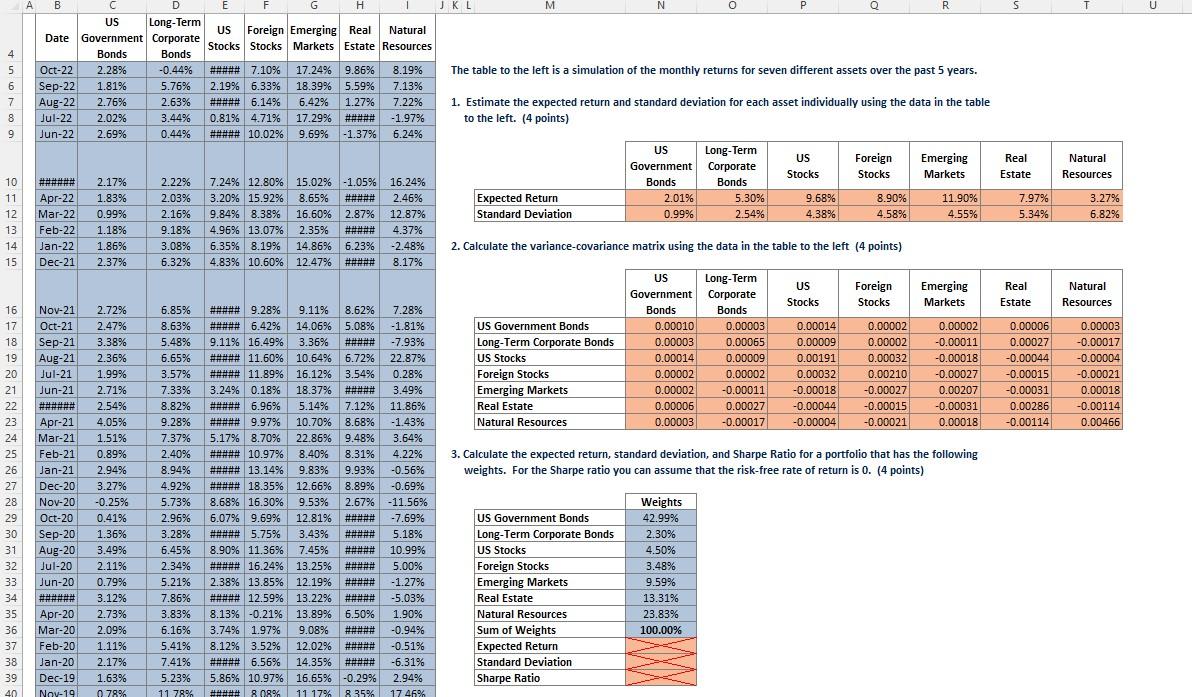
The table to the left is a simulation of the monthly returns for seven different assets over the past 5 years. 1. Estimate the expected return and standard deviation for each asset individually using the data in the table to the left. (4 points) 2. Calculate the variance-covariance matrix using the data in the table to the left (4 points) 3. Calculate the expected return, standard deviation, and Sharpe Ratio for a portfolio that has the following weights. For the Sharpe ratio you can assume that the risk-free rate of return is 0 . (4 points) The table to the left is a simulation of the monthly returns for seven different assets over the past 5 years. 1. Estimate the expected return and standard deviation for each asset individually using the data in the table to the left. (4 points) 2. Calculate the variance-covariance matrix using the data in the table to the left (4 points) 3. Calculate the expected return, standard deviation, and Sharpe Ratio for a portfolio that has the following weights. For the Sharpe ratio you can assume that the risk-free rate of return is 0 . (4 points)
Step by Step Solution
There are 3 Steps involved in it

Get step-by-step solutions from verified subject matter experts