

Question: Please show formulas and answer in the boxes Required information P13-5 (Algo) Computing Differences and Comparing Financial Statements Using Percentages LO 13-3, 13- 6 [The
Please show formulas and answer in the boxes
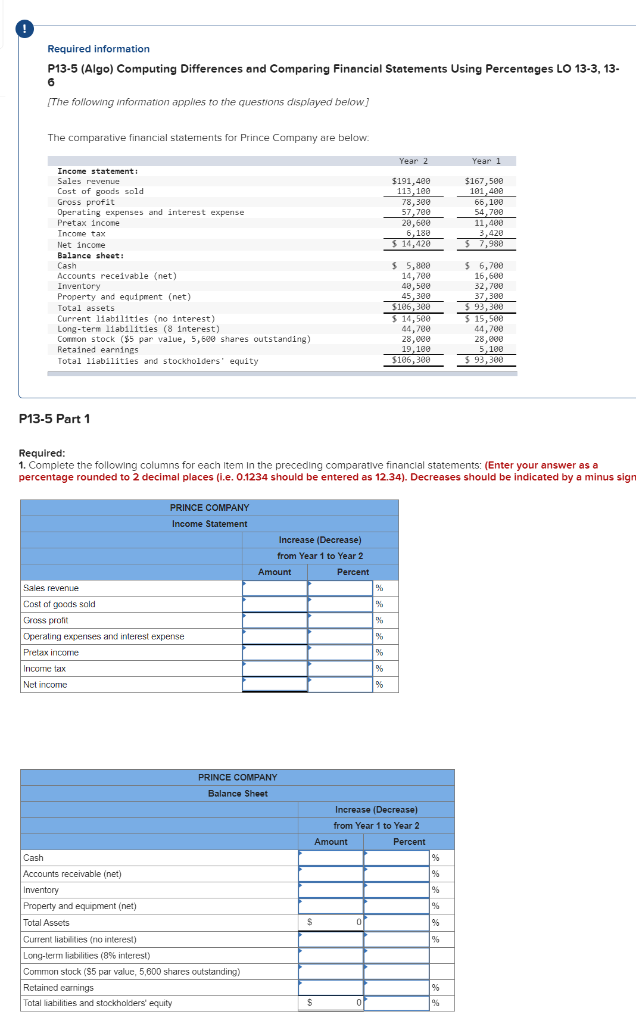
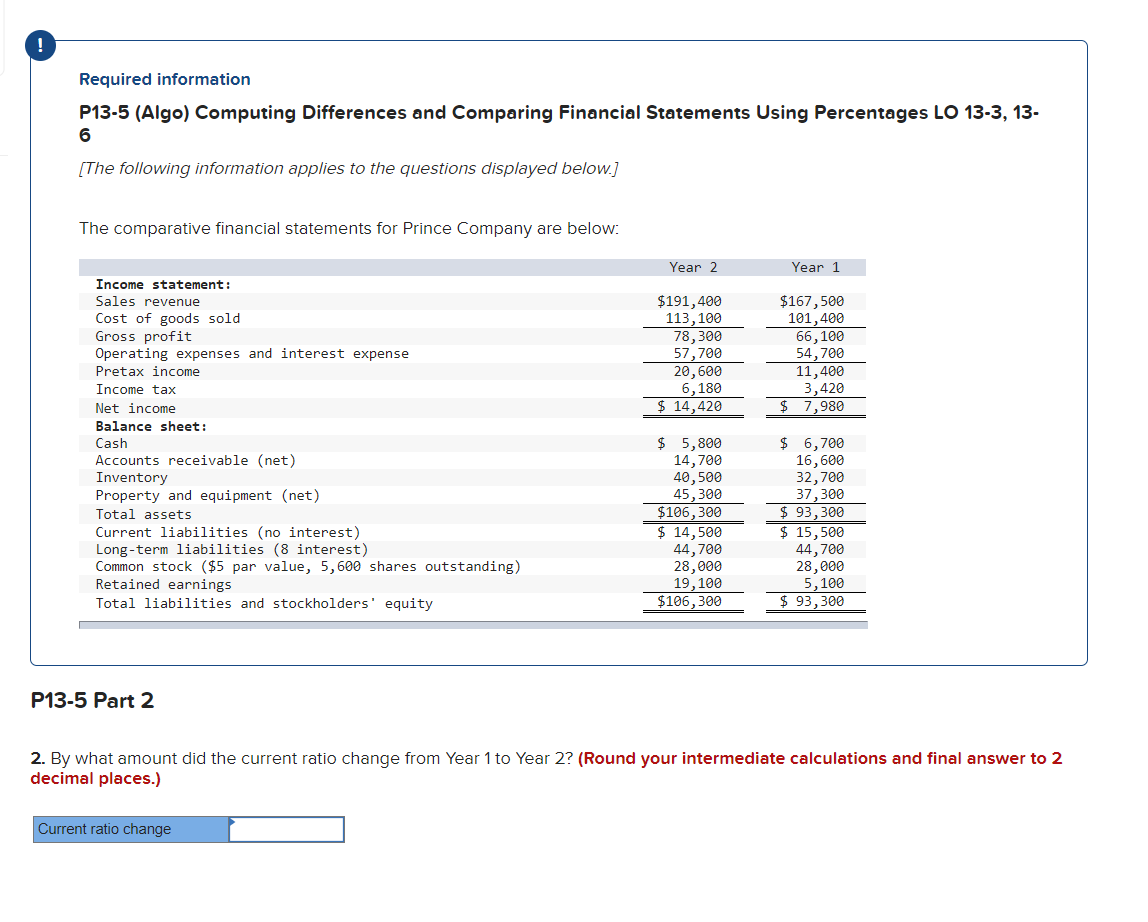
Required information P13-5 (Algo) Computing Differences and Comparing Financial Statements Using Percentages LO 13-3, 13- 6 [The following information applies to the questions displayed below] The comparative financial statements for Prince Company are below Year 2 Year 1 $191,480 113,100 78,300 57,700 28,680 6,188 $ 14,428 $167,500 101,400 66,100 54,700 11.400 3,420 $ 7,980 Income statement: Sales revenue Cost of goods sold Gross profit Operating expenses and interest expense Pretax income Income tax Net income Balance sheet: Cash Accounts receivable (net) Inventory Property and equipment (net) Total assets Current liabilities (no interest) Long-term liabilities (8 interest) Common stock ($5 par value, 5,500 shares outstanding) Retained earnings Total liabilities and stockholders' equity $ 5,800 14,788 48,500 45,380 $186,308 5 $ 14,500 44,780 28,000 19,100 $186,388 $ 6,700 16,600 32,700 37,380 $ 93,388 $ 15,500 44,700 28,000 5, 100 $ 93,300 P13-5 Part 1 Required: 1. Complete the following columns for each item in the preceding comparative financial statements: (Enter your answer as a percentage rounded to 2 decimal places (i.e. 0.1234 should be entered as 12.34). Decreases should be indicated by a minus sign PRINCE COMPANY Income Statement Increase (Decrease) from Year 1 to Year 2 Amount Percent % % Sales revenue Cost of goods sold Gross profit Operating expenses and interest expense Prelax income Income tax Net income % % % % PRINCE COMPANY Balance Sheet Increase (Decrease) from Year 1 to Year 2 Amount Percent % % % % S 96 Cash Accounts receivable (net) Inventory Property Property and equipment (net) Total Assets Current liabilities (no interest) Long-term liabilities (8% interest) Common stock (35 par value, 5,600 shares outstanding) Retained carnings Total liabilities and stockholders' equity % % S 0 % Required information P13-5 (Algo) Computing Differences and Comparing Financial Statements Using Percentages LO 13-3, 13. 6 [The following information applies to the questions displayed below.] The comparative financial statements for Prince Company are below: Year 2 Year 1 $167,500 101,400 66,100 $191,400 113,100 78,300 57,700 20,600 6,180 $ 14,420 54,700 11,400 3,420 7,980 $ Income statement: Sales revenue Cost of goods sold Gross profit Operating expenses and interest expense Pretax income Income tax Net income Balance sheet: Cash Accounts receivable (net) Inventory Property and equipment (net) Total assets Current liabilities (no interest) Long-term liabilities (8 interest) Common stock ($5 par value, 5,600 shares outstanding) Retained earnings Total liabilities and stockholders' equity $ 5,800 14,700 40,500 45,300 $106,300 $ 14,500 44,700 28,000 19, 100 $106,300 $ 6,700 16,600 32,700 37,300 $ 93,300 $ 15,500 44,700 28,000 5,100 $ 93,300 P13-5 Part 2 2. By what amount did the current ratio change from Year 1 to Year 2? (Round your intermediate calculations and final answer to 2 decimal places.) Current ratio change
Step by Step Solution
There are 3 Steps involved in it

Get step-by-step solutions from verified subject matter experts