

Question: Please show formulas and range for chart. Multiplicative Model -3 Questions: Show each step, and answer the following questions below: places)? your forecasted monthly demand
Please show formulas and range for chart.
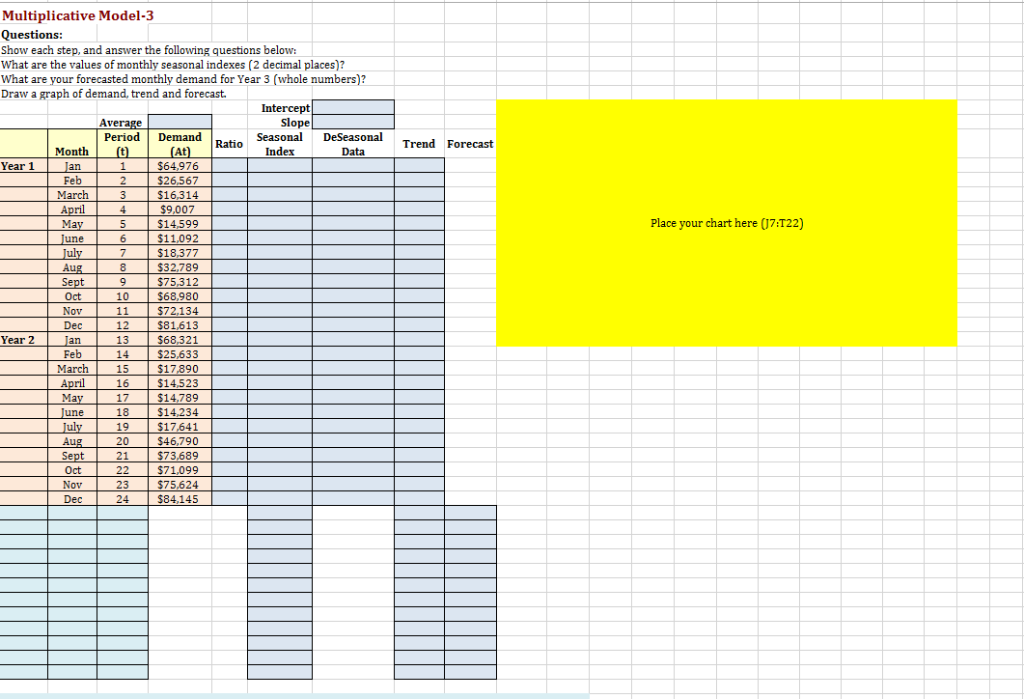
Multiplicative Model -3 Questions: Show each step, and answer the following questions below: places)? your forecasted monthly demand for Year 3 (whole numbers)? What Draw a graph of demand, trend and forecast. Intercept Slope Seasonal Average Period Demand DeSeasonal Ratio Trend Forecast Month (At) $64,976 Index (t Data Year 1 ar Feb 2 $26,567 March $16,314 April Place your chart here (J7:T22) 99 June $11.092 $18.377 July 7 $32,789 Aug $75,312 Sept Oct 10 $68,980 $72,134 Nov Der 12 $81,613 Year 2 $68,321 Tan 13 14 $25,633 Feb March $14.523 $14,789 May 17 June 11 $14,234 July $17,641 19 Aug 20 $46,790 $73.689 Sep 21 Oct 22 $71,099 Nov 23 $75,624 $84.145 Dec 24 Multiplicative Model -3 Questions: Show each step, and answer the following questions below: places)? your forecasted monthly demand for Year 3 (whole numbers)? What Draw a graph of demand, trend and forecast. Intercept Slope Seasonal Average Period Demand DeSeasonal Ratio Trend Forecast Month (At) $64,976 Index (t Data Year 1 ar Feb 2 $26,567 March $16,314 April Place your chart here (J7:T22) 99 June $11.092 $18.377 July 7 $32,789 Aug $75,312 Sept Oct 10 $68,980 $72,134 Nov Der 12 $81,613 Year 2 $68,321 Tan 13 14 $25,633 Feb March $14.523 $14,789 May 17 June 11 $14,234 July $17,641 19 Aug 20 $46,790 $73.689 Sep 21 Oct 22 $71,099 Nov 23 $75,624 $84.145 Dec 24
Step by Step Solution
There are 3 Steps involved in it

Get step-by-step solutions from verified subject matter experts