

Question: please show formulas Calculate the Implied FB Target Price Using Each Multiple (1) Apply the Selected 'Comps' Average Multiple to the FB 2022E Financial Data
 please show formulas
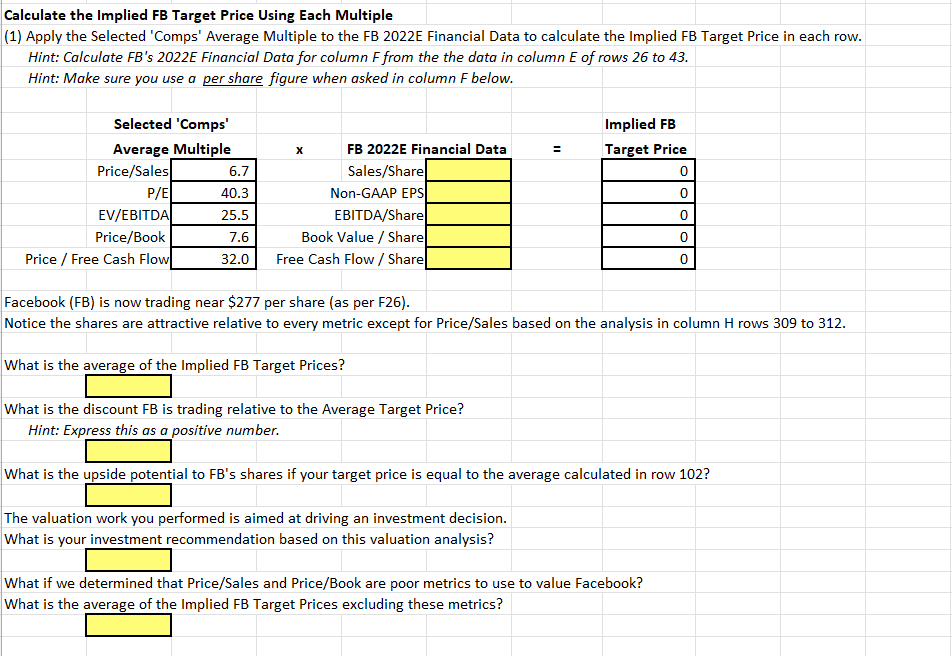
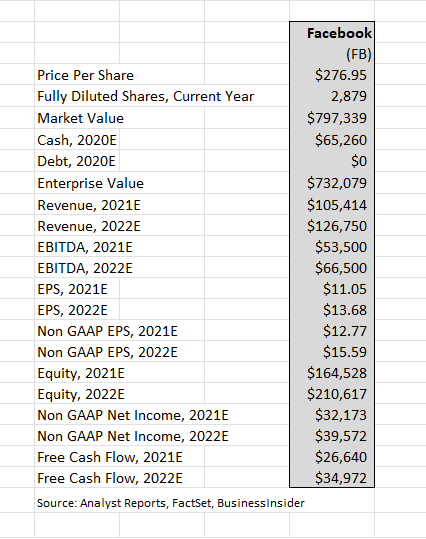
Calculate the Implied FB Target Price Using Each Multiple (1) Apply the Selected 'Comps' Average Multiple to the FB 2022E Financial Data to calculate the Implied FB Target Price in each row. Hint: Calculate FB's 2022E Financial Data for column F from the the data in column E of rows 26 to 43. Hint: Make sure you use a per share figure when asked in column F below. Selected 'Comps Average Multiple Price/Sales 6.7 P/E 40.3 EV/EBITDA 25.5 Price/Book 7.6 Price / Free Cash Flow 32.0 FB 2022E Financial Data Sales/Share Non-GAAP EPS EBITDA/Sharel Book Value / Share Free Cash Flow / Share! Implied FB Target Price 0 0 0 0 0 Facebook (FB) is now trading near $277 per share (as per F26). Notice the shares are attractive relative to every metric except for Price/Sales based on the analysis in column H rows 309 to 312. What is the average of the Implied FB Target Prices? What is the discount FB is trading relative to the Average Target Price? Hint: Express this as a positive number. What is the upside potential to FB's shares if your target price is equal to the average calculated in row 102? The valuation work you performed is aimed at driving an investment decision. What is your investment recommendation based on this valuation analysis? What if we determined that Price/Sales and Price/Book are poor metrics to use to value Facebook? What is the average of the Implied FB Target Prices excluding these metrics? Facebook (FB) Price Per Share $276.95 Fully Diluted Shares, Current Year 2,879 Market Value $797,339 Cash, 2020E $65,260 Debt, 2020E $0 Enterprise Value $732,079 Revenue, 2021E $105,414 Revenue, 2022E $126,750 EBITDA, 2021E $53,500 EBITDA, 2022E $66,500 EPS, 2021E $11.05 EPS, 2022E $13.68 Non GAAP EPS, 2021E $12.77 Non GAAP EPS, 2022E $15.59 Equity, 2021E $164,528 Equity, 2022E $210,617 Non GAAP Net Income, 2021E $32,173 Non GAAP Net Income, 2022E $39,572 Free Cash Flow, 2021E $26,640 Free Cash Flow, 2022E $34,972 Source: Analyst Reports, FactSet, Businessinsider Calculate the Implied FB Target Price Using Each Multiple (1) Apply the Selected 'Comps' Average Multiple to the FB 2022E Financial Data to calculate the Implied FB Target Price in each row. Hint: Calculate FB's 2022E Financial Data for column F from the the data in column E of rows 26 to 43. Hint: Make sure you use a per share figure when asked in column F below. Selected 'Comps Average Multiple Price/Sales 6.7 P/E 40.3 EV/EBITDA 25.5 Price/Book 7.6 Price / Free Cash Flow 32.0 FB 2022E Financial Data Sales/Share Non-GAAP EPS EBITDA/Sharel Book Value / Share Free Cash Flow / Share! Implied FB Target Price 0 0 0 0 0 Facebook (FB) is now trading near $277 per share (as per F26). Notice the shares are attractive relative to every metric except for Price/Sales based on the analysis in column H rows 309 to 312. What is the average of the Implied FB Target Prices? What is the discount FB is trading relative to the Average Target Price? Hint: Express this as a positive number. What is the upside potential to FB's shares if your target price is equal to the average calculated in row 102? The valuation work you performed is aimed at driving an investment decision. What is your investment recommendation based on this valuation analysis? What if we determined that Price/Sales and Price/Book are poor metrics to use to value Facebook? What is the average of the Implied FB Target Prices excluding these metrics? Facebook (FB) Price Per Share $276.95 Fully Diluted Shares, Current Year 2,879 Market Value $797,339 Cash, 2020E $65,260 Debt, 2020E $0 Enterprise Value $732,079 Revenue, 2021E $105,414 Revenue, 2022E $126,750 EBITDA, 2021E $53,500 EBITDA, 2022E $66,500 EPS, 2021E $11.05 EPS, 2022E $13.68 Non GAAP EPS, 2021E $12.77 Non GAAP EPS, 2022E $15.59 Equity, 2021E $164,528 Equity, 2022E $210,617 Non GAAP Net Income, 2021E $32,173 Non GAAP Net Income, 2022E $39,572 Free Cash Flow, 2021E $26,640 Free Cash Flow, 2022E $34,972 Source: Analyst Reports, FactSet, Businessinsider
Step by Step Solution
There are 3 Steps involved in it

Get step-by-step solutions from verified subject matter experts