

Question: PLEASE SHOW FORMULAS CORRELATING TO THE PICTURE A E 6 7 Percent 8 9 Net sales 10 Cost of goods sold 11 Gross profit 12
 PLEASE SHOW FORMULAS CORRELATING TO THE PICTURE
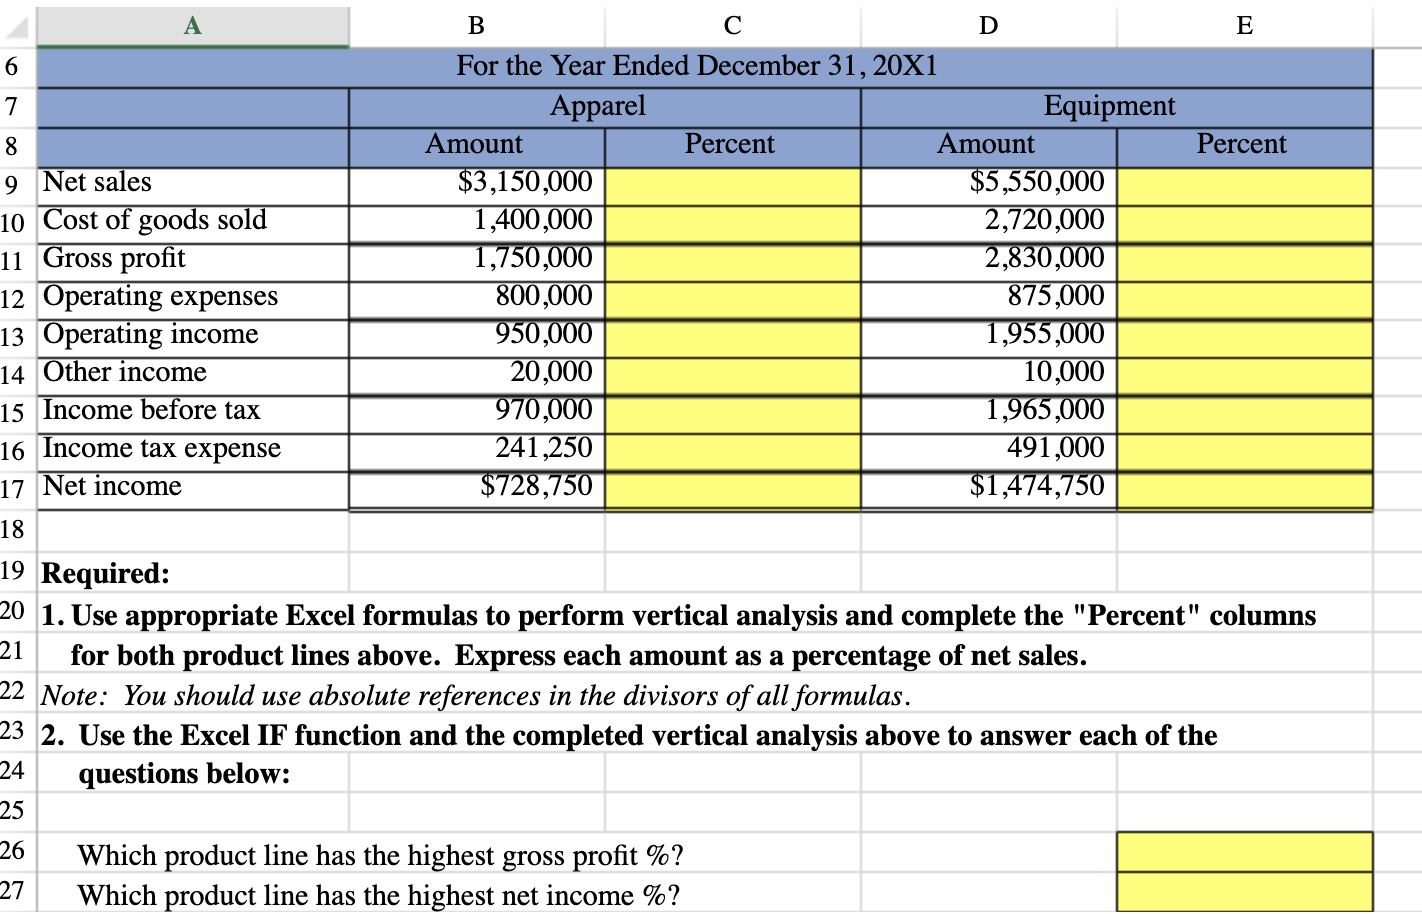
A E 6 7 Percent 8 9 Net sales 10 Cost of goods sold 11 Gross profit 12 Operating expenses 13 Operating income 14 Other income 15 Income before tax 16 Income tax expense 17 Net income B D For the Year Ended December 31, 20X1 Apparel Equipment Amount Percent Amount $3,150,000 $5,550,000 1,400,000 2,720,000 1,750,000 2,830,000 800,000 875,000 950,000 1,955,000 20,000 10,000 970,000 1,965,000 241,250 491,000 $728,750 $1,474,750 18 21 19 Required: 20 1. Use appropriate Excel formulas to perform vertical analysis and complete the "Percent" columns for both product lines above. Express each amount as a percentage of net sales. 22 Note: You should use absolute references in the divisors of all formulas. 23 2. Use the Excel IF function and the completed vertical analysis above to answer each of the 24 questions below: 25 26 Which product line has the highest gross profit %? Which product line has the highest net income %? 27
Step by Step Solution
There are 3 Steps involved in it

Get step-by-step solutions from verified subject matter experts