

Question: *PLEASE SHOW FORMULAS FOR HIGLIGHTED BOXES* *ZOOM IN FOR NUMBERS* Insert formulas and cell references into the gold cells below. Selected Financial Data - Muesli
*PLEASE SHOW FORMULAS FOR HIGLIGHTED BOXES* *ZOOM IN FOR NUMBERS*
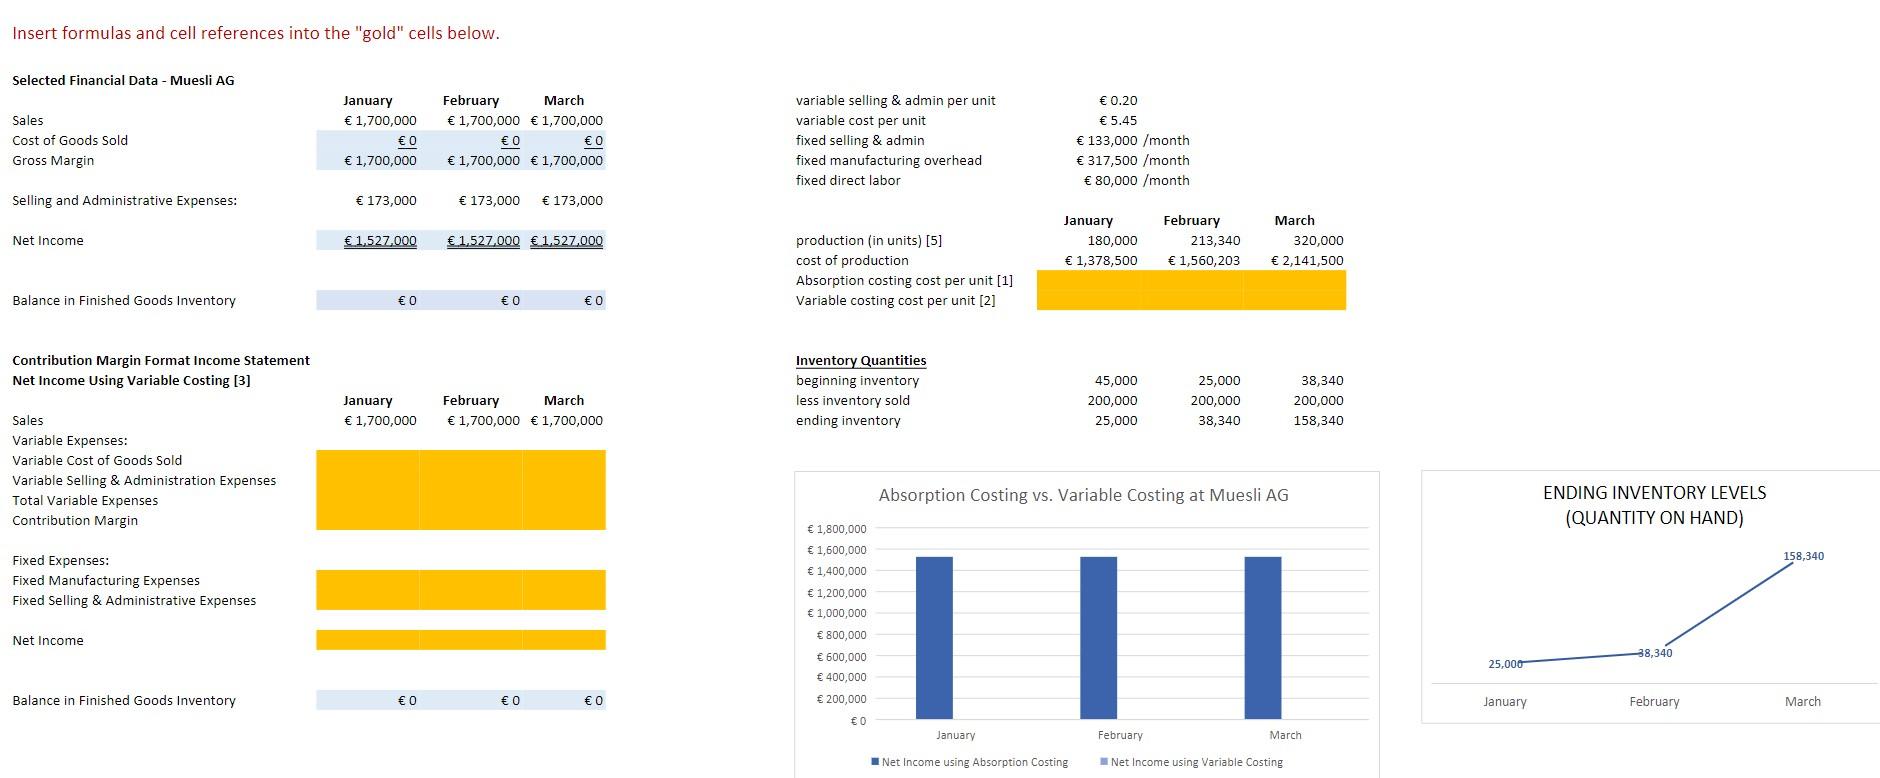
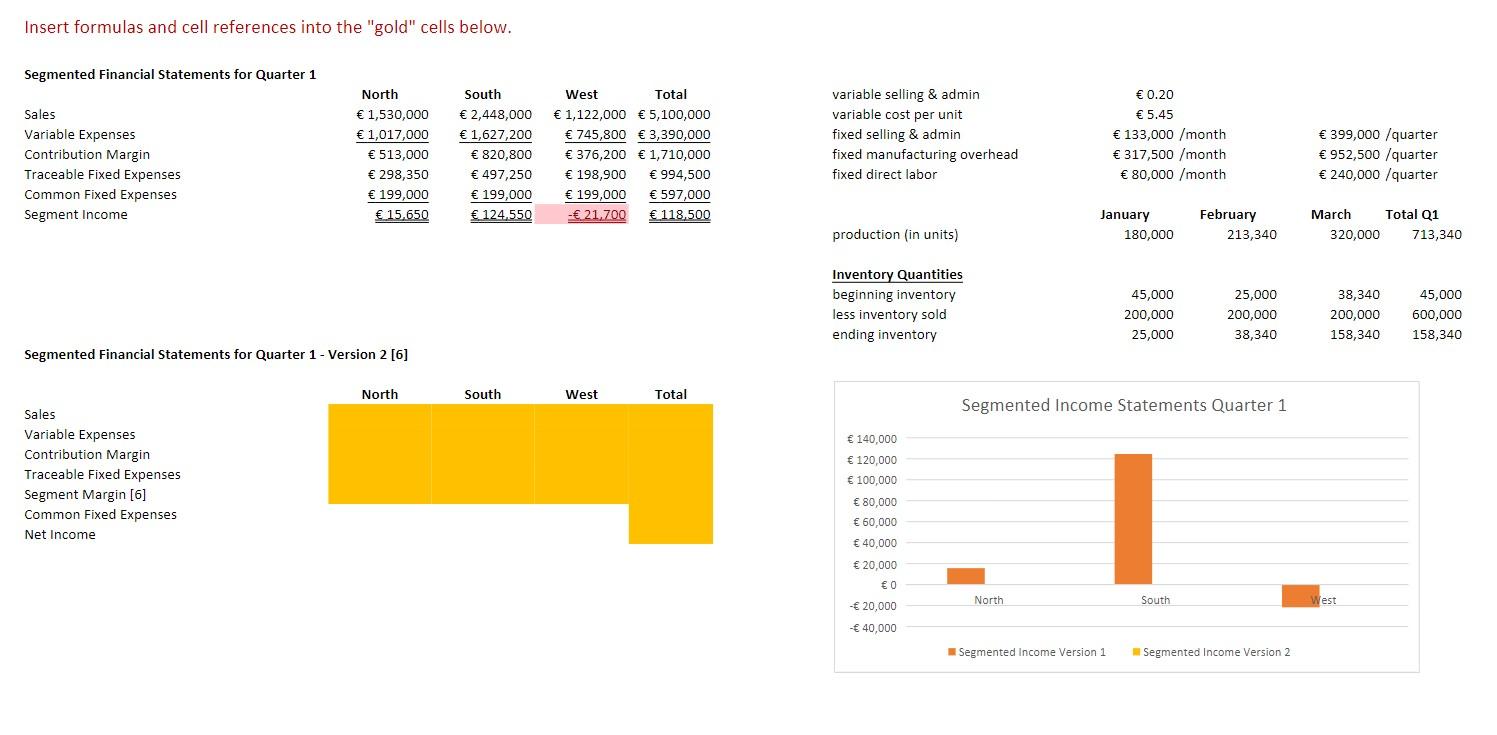
Insert formulas and cell references into the "gold" cells below. Selected Financial Data - Muesli AG Sales Cost of Goods Sold Gross Margin January 1,700,000 0 1,700,000 February March 1,700,000 1,700,000 0 0 1,700,000 1,700,000 variable selling & admin per unit variable cost per unit fixed selling & admin fixed manufacturing overhead fixed direct labor 0.20 5.45 133,000 /month 317,500 /month 80,000 /month Selling and Administrative Expenses: 173,000 173,000 173,000 Net Income 1.527,000 1.527.000 1.527.000 January 180,000 1,378,500 February 213,340 1,560,203 March 320,000 2,141,500 production (in units) [5] cost of production Absorption costing cost per unit [1] Variable costing cost per unit [2] Balance in Finished Goods Inventory 0 0 0 Contribution Margin Format Income Statement Net Income Using Variable Costing [3] Inventory Quantities beginning inventory less inventory sold ending inventory January 1,700,000 February March 1,700,000 1,700,000 45,000 200,000 25,000 25,000 200,000 38,340 38,340 200,000 158,340 Sales Variable Expenses: Variable Cost of Goods Sold Variable Selling & Administration Expenses Total Variable Expenses Contribution Margin Absorption Costing vs. Variable Costing at Muesli AG ENDING INVENTORY LEVELS (QUANTITY ON HAND) 1,800,000 1,600,000 158,340 Fixed Expenses: Fixed Manufacturing Expenses Fixed Selling & Administrative Expenses 1,400,000 1,200,000 1,000,000 800,000 600,000 400,000 Net Income 38,340 25,000 Balance in Finished Goods Inventory 0 0 0 200,000 January February March 0 January February March Net Income using Absorption Costing Net Income using Variable Costing Insert formulas and cell references into the "gold" cells below. Segmented Financial Statements for Quarter 1 Sales Variable Expenses Contribution Margin Traceable Fixed Expenses Common Fixed Expenses Segment Income North 1,530,000 1,017,000 513,000 298,350 199,000 15.650 South 2,448,000 1,627,200 820,800 497,250 199,000 124,550 West Total 1,122,000 5,100,000 745,800 3,390,000 376,200 1,710,000 198,900 994,500 199,000 597,000 - 21.700 118.500 variable selling & admin variable cost per unit fixed selling & admin fixed manufacturing overhead fixed direct labor 0.20 5.45 133,000 /month 317,500 /month 80,000 /month 399,000 /quarter 952,500 /quarter 240,000 /quarter January 180,000 February 213,340 March Total Q1 320,000 713,340 production (in units) Inventory Quantities beginning inventory less inventory sold ending inventory 45,000 200,000 25,000 25,000 200,000 38,340 38,340 200,000 158,340 45,000 600,000 158,340 Segmented Financial Statements for Quarter 1 - Version 2 [6] North South West Total Segmented Income Statements Quarter 1 140,000 Sales Variable Expenses Contribution Margin Traceable Fixed Expenses Segment Margin [6] Common Fixed Expenses Net Income 120,000 100,000 80,000 60,000 40,000 20,000 0 North South Test - 20,000 - 40,000 Segmented Income Version 1 Segmented Income Version 2 Insert formulas and cell references into the "gold" cells below. Selected Financial Data - Muesli AG Sales Cost of Goods Sold Gross Margin January 1,700,000 0 1,700,000 February March 1,700,000 1,700,000 0 0 1,700,000 1,700,000 variable selling & admin per unit variable cost per unit fixed selling & admin fixed manufacturing overhead fixed direct labor 0.20 5.45 133,000 /month 317,500 /month 80,000 /month Selling and Administrative Expenses: 173,000 173,000 173,000 Net Income 1.527,000 1.527.000 1.527.000 January 180,000 1,378,500 February 213,340 1,560,203 March 320,000 2,141,500 production (in units) [5] cost of production Absorption costing cost per unit [1] Variable costing cost per unit [2] Balance in Finished Goods Inventory 0 0 0 Contribution Margin Format Income Statement Net Income Using Variable Costing [3] Inventory Quantities beginning inventory less inventory sold ending inventory January 1,700,000 February March 1,700,000 1,700,000 45,000 200,000 25,000 25,000 200,000 38,340 38,340 200,000 158,340 Sales Variable Expenses: Variable Cost of Goods Sold Variable Selling & Administration Expenses Total Variable Expenses Contribution Margin Absorption Costing vs. Variable Costing at Muesli AG ENDING INVENTORY LEVELS (QUANTITY ON HAND) 1,800,000 1,600,000 158,340 Fixed Expenses: Fixed Manufacturing Expenses Fixed Selling & Administrative Expenses 1,400,000 1,200,000 1,000,000 800,000 600,000 400,000 Net Income 38,340 25,000 Balance in Finished Goods Inventory 0 0 0 200,000 January February March 0 January February March Net Income using Absorption Costing Net Income using Variable Costing Insert formulas and cell references into the "gold" cells below. Segmented Financial Statements for Quarter 1 Sales Variable Expenses Contribution Margin Traceable Fixed Expenses Common Fixed Expenses Segment Income North 1,530,000 1,017,000 513,000 298,350 199,000 15.650 South 2,448,000 1,627,200 820,800 497,250 199,000 124,550 West Total 1,122,000 5,100,000 745,800 3,390,000 376,200 1,710,000 198,900 994,500 199,000 597,000 - 21.700 118.500 variable selling & admin variable cost per unit fixed selling & admin fixed manufacturing overhead fixed direct labor 0.20 5.45 133,000 /month 317,500 /month 80,000 /month 399,000 /quarter 952,500 /quarter 240,000 /quarter January 180,000 February 213,340 March Total Q1 320,000 713,340 production (in units) Inventory Quantities beginning inventory less inventory sold ending inventory 45,000 200,000 25,000 25,000 200,000 38,340 38,340 200,000 158,340 45,000 600,000 158,340 Segmented Financial Statements for Quarter 1 - Version 2 [6] North South West Total Segmented Income Statements Quarter 1 140,000 Sales Variable Expenses Contribution Margin Traceable Fixed Expenses Segment Margin [6] Common Fixed Expenses Net Income 120,000 100,000 80,000 60,000 40,000 20,000 0 North South Test - 20,000 - 40,000 Segmented Income Version 1 Segmented Income Version 2
Step by Step Solution
There are 3 Steps involved in it

Get step-by-step solutions from verified subject matter experts