

Question: Please show formulas on excel sheet as below Excel Online Structured Activity: NPV profiles A company is considering two mutually exclusive expansion plans. Pian A
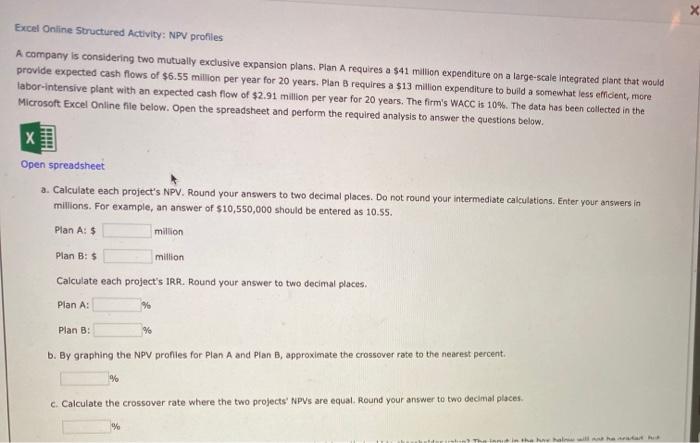
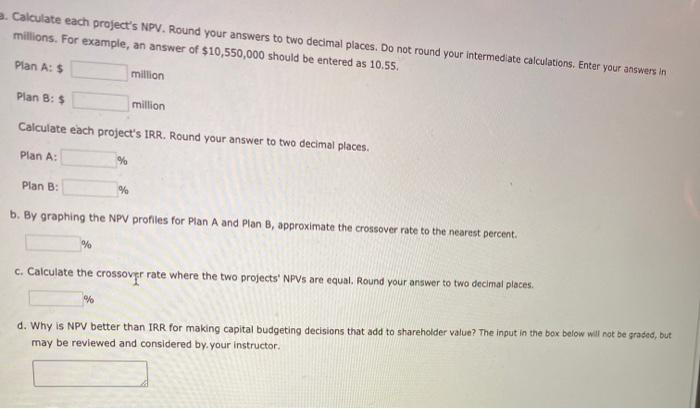
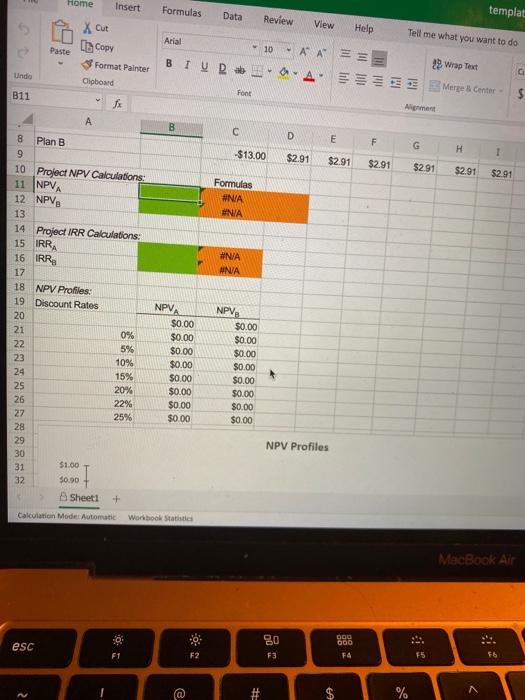
Excel Online Structured Activity: NPV profiles A company is considering two mutually exclusive expansion plans. Pian A requires a $41 million expenditure on a large-scale integrated plant that would provide expected cash flows of $6.55 million per year for 20 years. Plan B requires a $13 million expenditure to build a somewhat less efficient, more tabor-intensive plant with an expected cash flow of $2.91 million per year for 20 years. The firm's WACC is 10%. The data has been collected in the Microsoft Excel Online file below. Open the spreadsheet and perform the required analysis to answer the questions below. X Open spreadsheet a. Calculate each project's NPV. Round your answers to two decimal places. Do not round your intermediate calculations. Enter your answers in millions. For example, an answer of $10,550,000 should be entered as 10.55. Plan A: $ million Plan B: $ million Calculate each project's IRR. Round your answer to two decimal places Plan A: Plan B : b. By graphing the NPV profiles for Plan A and Plan B, approximate the crossover rate to the nearest percent. % c. Calculate the crossover rate where the two projects' NPVs are equal. Round your answer to two decimal places % 2. Calculate each project's NPV. Round your answers to two decimal places. Do not round your intermediate calculations. Enter your answers in millions. For example, an answer of $10,550,000 should be entered as 10.55. Plan A: 5 million Plan B: $ million Calculate each project's IRR. Round your answer to two decimal places. Plan A: % Plan B : % b. By graphing the NPV profiles for Plan A and Plan B, approximate the crossover rate to the nearest percent c. Calculate the crossover rate where the two projects' NPVs are equal. Round your answer to two decimal places. d. Why is NPV better than IRR for making capital budgeting decisions that add to shareholder value? The input in the box below will not be grated, but may be reviewed and considered by your instructor Home Insert Formulas Data templat Review X Cut View Help Tell me what you want to do Arial Paste 10 1 Copy Format Painter Clipboard BIUR. AAEE A. Wrap Text Undio Merge Center B11 Font f Alignment B D E F H $13.00 1 $2.91 $2.91 $2.91 $2.91 $2.91 $2.91 Formulas #NA #NIA #N/A ANA 8 Plan B 9 10 Project NPV Calculations: 11 NPVA 12 NPVE 13 14 Project IRR Calculations: 15 IRRA 16 IRR, 17 18 NPV Profiles: 19 Discount Rates 20 21 0% 22 5% 23 10% 24 15% 25 20% 26 22% 27 25% 28 29 30 31 $1.00 32 $0.90 Sheet1 + NPVA $0.00 $0.00 $0.00 $0.00 $0.00 $0.00 $0.00 $0.00 NPV $0.00 $0.00 $0.00 $0.00 $0.00 $0.00 $0.00 $0.00 NPV Profiles Calculation Mode: Automatic WorkbookStatistic MacBook Air 80 DOO 000 esc F1 F2 F3 FA 75 F6 @ #
Step by Step Solution
There are 3 Steps involved in it

Get step-by-step solutions from verified subject matter experts