

Question: please show graph and steps for 6-9 so I can learn how to do it. Thank you! Assume that you are managing a warehouse that
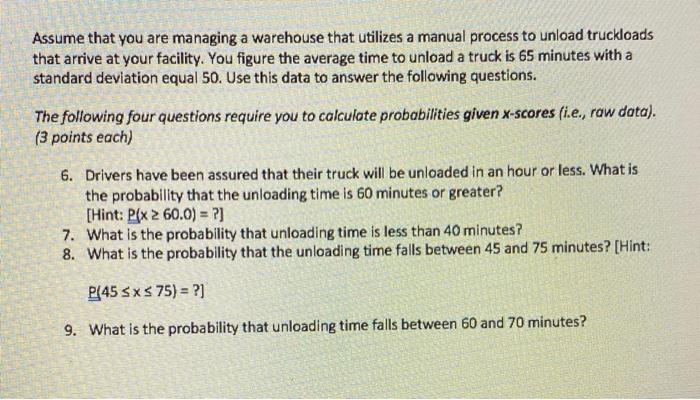
Assume that you are managing a warehouse that utilizes a manual process to unload truckloads that arrive at your facility. You figure the average time to unload a truck is 65 minutes with a standard deviation equal 50 . Use this data to answer the following questions. The following four questions require you to calculote probabilities given x-scores (i.e., raw data). ( 3 points each) 6. Drivers have been assured that their truck will be unloaded in an hour or less. What is the probability that the unloading time is 60 minutes or greater? [Hint: P(x60.0)= ?] 7. What is the probability that unloading time is less than 40 minutes? 8. What is the probability that the unloading time falls between 45 and 75 minutes? [Hint: P(45x75)=?] 9. What is the probability that unloading time falls between 60 and 70 minutes
Step by Step Solution
There are 3 Steps involved in it

Get step-by-step solutions from verified subject matter experts