

Question: Please show how NPV is calculated in question 1. Please show excel formulas for all calculations 1983 0.00 1984 1.00 1985 2.00 1986 3.00 1987
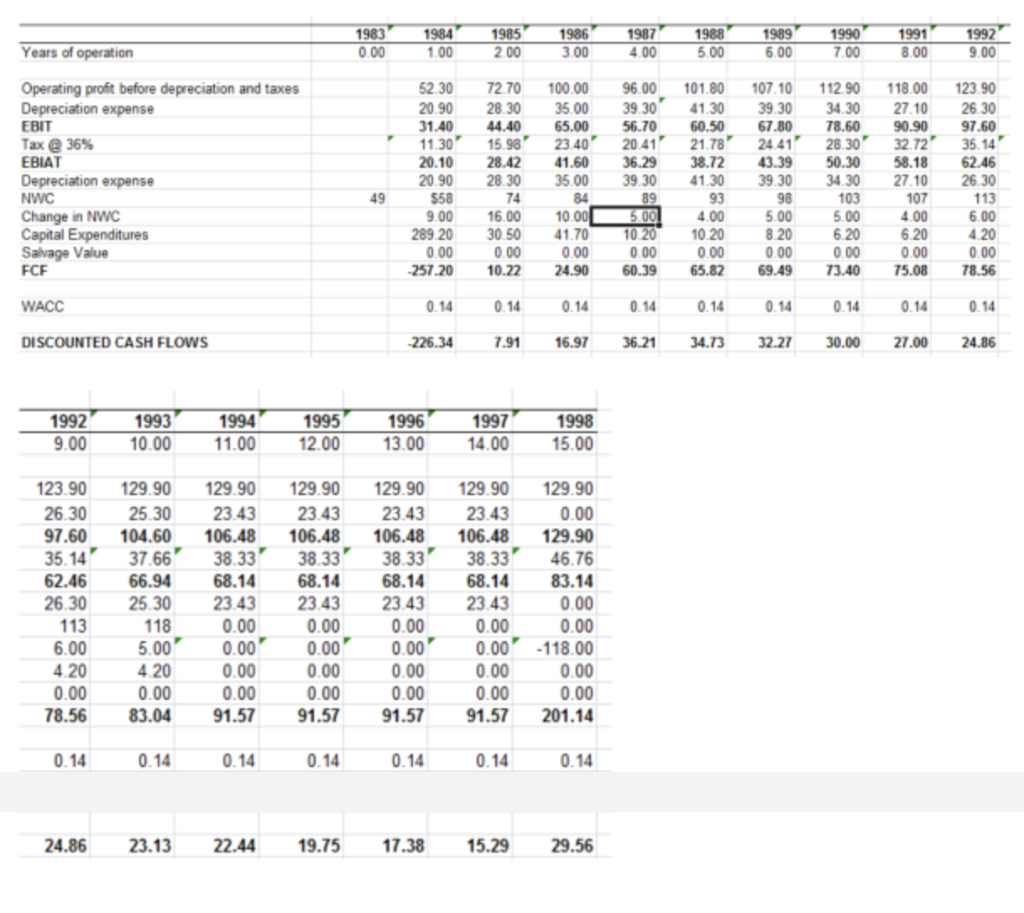
Please show how NPV is calculated in question 1. Please show excel formulas for all calculations
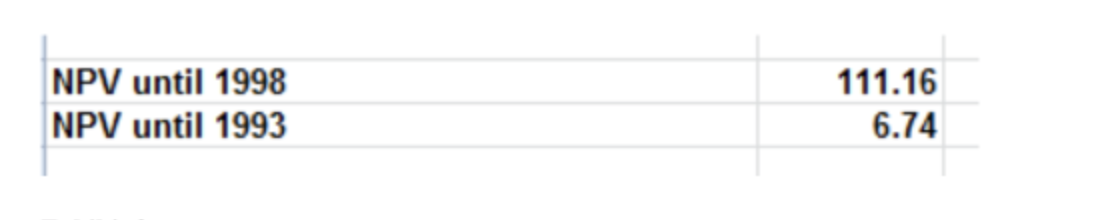
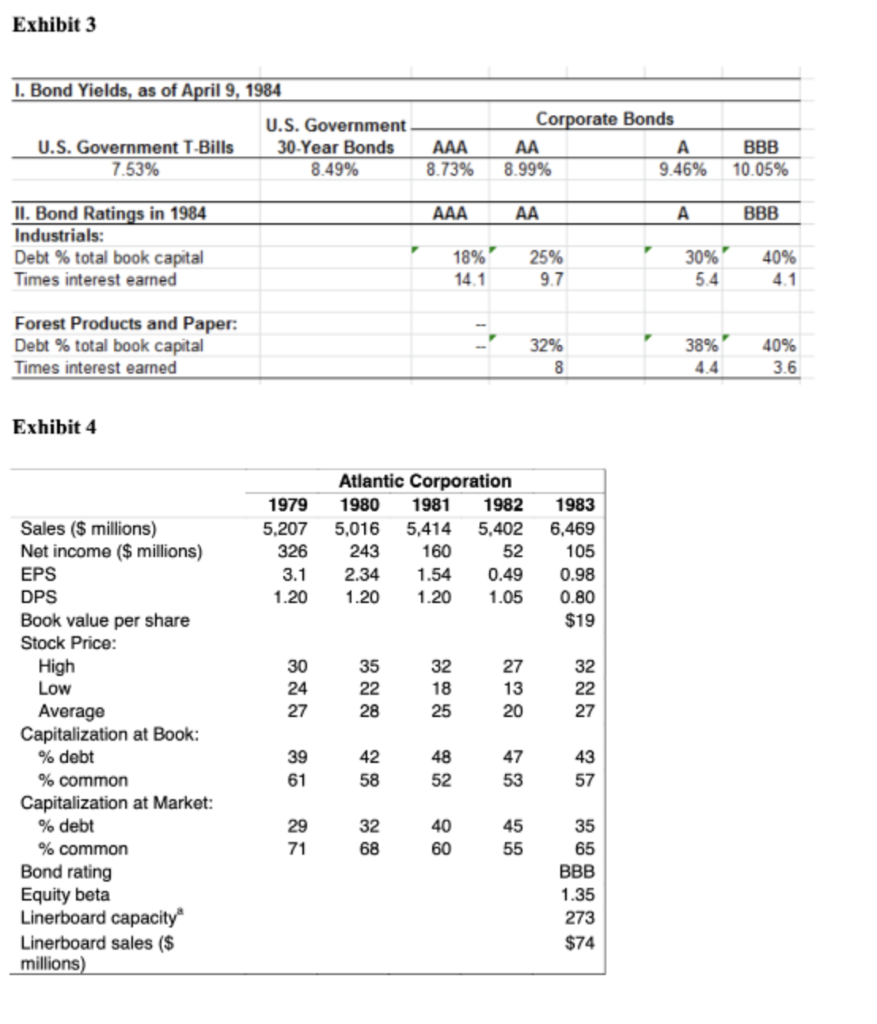
1983 0.00 1984 1.00 1985 2.00 1986 3.00 1987 400 1988 5.00 1989 6.00 1990 7.00 1991 8.00 1992 9.00 Years of operation 52.30 20.90 31.40 96.00 39 30 56.70 100.00 35.00 65.00 23.40 41.60 35.00 112.90 34.30 78.60 118.00 27.10 90.90 123.90 26.30 97.60 11.30 20.41 28 30 Operating profit before depreciation and taxes Depreciation expense EBIT Tax 36% EBIAT Depreciation expense NWC Change in NWC Capital Expenditures Salvage Value FCF 32.72 107 10 39.30 67.80 24 41 43.39 39.30 98 35.14 72.70 28.30 44.40 15.98 28.42 28.30 74 16.00 30.50 0.00 10.22 20.10 20.90 558 9.00 289 20 0.00 -257.20 101.80 41.30 60.50 21.78 38.72 41.30 93 4.00 10 20 0.00 65.82 49 36.29 39 30 89 5.00 10 20 0.00 60.39 10.00 41.70 0.00 24.90 5.00 50.30 34 30 103 5.00 6.20 0.00 73.40 58.18 27.10 107 4.00 6.20 0.00 75.08 62.46 26 30 113 6.00 4.20 0.00 78.56 8.20 0.00 69.49 WACC 0.14 0.14 0.14 0.14 0.14 0.14 0.14 0.14 0.14 DISCOUNTED CASH FLOWS -226.34 7.91 16.97 36.21 34.73 32.27 30.00 27.00 24.86 1992 9.00 1993 10.00 1994 11.00 1995 12.00 1996 13.00 1997 14.00 1998 15.00 123.90 26.30 97.60 35.14 62.46 26.30 113 6.00 4.20 0.00 78.56 129.90 25.30 104.60 37.66 66.94 25.30 118 5.00 4.20 0.00 83.04 129.90 23.43 106.48 38.33 68.14 23.43 0.00 0.00 0.00 0.00 91.57 129.90 23.43 106.48 38.33 68.14 23.43 0.00 0.00 0.00 0.00 91.57 129.90 23.43 106.48 38.33 68.14 23.43 0.00 0.00 0.00 0.00 91.57 129.90 23.43 106.48 38.331 68.14 23.43 0.00 0.00 0.00 0.00 91.57 129.90 0.00 129.90 46.76 83.14 0.00 0.00 -118.00 0.00 0.00 201.14 0.14 0.14 0.14 0.14 0.14 0.14 0.14 24.86 23.13 22.44 19.75 17.38 15.29 29.56 NPV until 1998 NPV until 1993 111.16 6.74 Exhibit 3 I. Bond Yields, as of April 9, 1984 U.S. Government U.S. Government T-Bills 30-Year Bonds 7.53% 8.49% AAA 8.73% Corporate Bonds AA A 8.99% 9.46% BBB 10.05% AAA AA BBB II. Bond Ratings in 1984 Industrials: Debt % total book capital Times interest earned 18%' 25% 9.7 30% 5.4 40% 4.1 14.1 Forest Products and Paper: Debt % total book capital Times interest earned 32% 8 38% 4.4 40% 3.6 Exhibit 4 1979 5,207 326 3.1 1.20 Atlantic Corporation 1980 1981 1982 5,016 5,414 5,402 243 160 52 2.34 1.54 0.49 1.20 1.20 1.05 1983 6,469 105 0.98 0.80 $19 30 24 27 35 22 28 32 18 25 27 13 20 32 22 27 Sales ($ millions) Net income ($ millions) EPS DPS Book value per share Stock Price: High Low Average Capitalization at Book: % debt % common Capitalization at Market: % debt % common Bond rating Equity beta Linerboard capacity Linerboard sales ($ millions) 39 61 42 58 48 52 47 53 43 57 29 71 32 68 40 60 45 55 35 65 BBB 1.35 273 $74
Step by Step Solution
There are 3 Steps involved in it

Get step-by-step solutions from verified subject matter experts