

Question: Please show how to compute the arithmetic average, geometric average, and standard deviation for both the S&P 500 Index and the Broad Market Index using
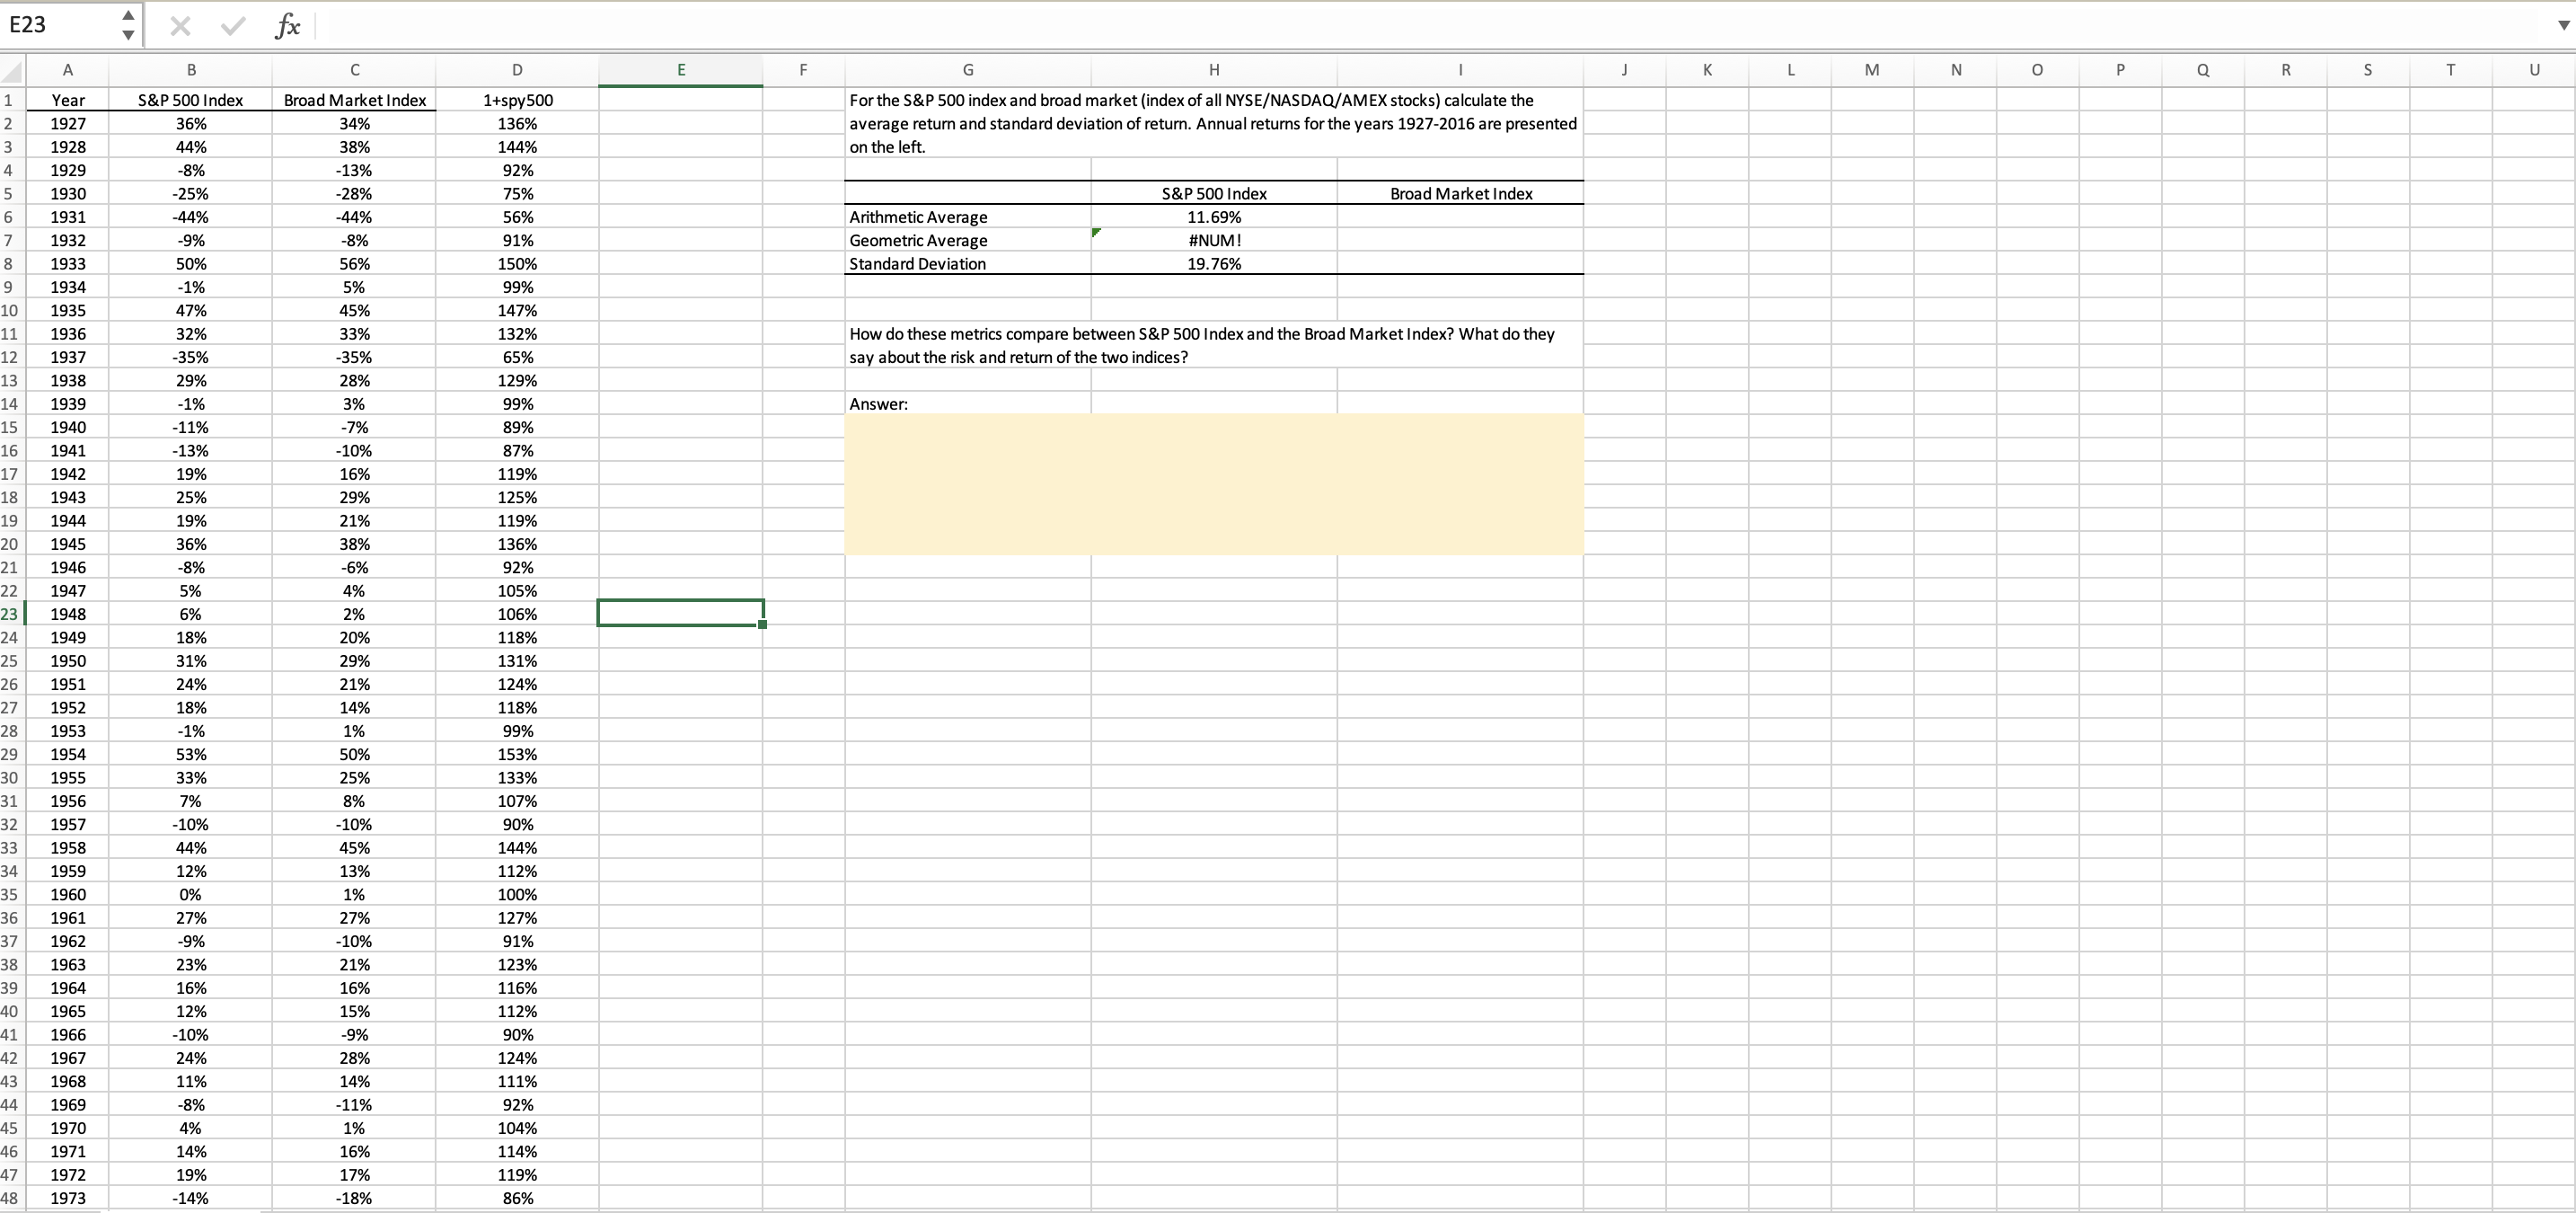
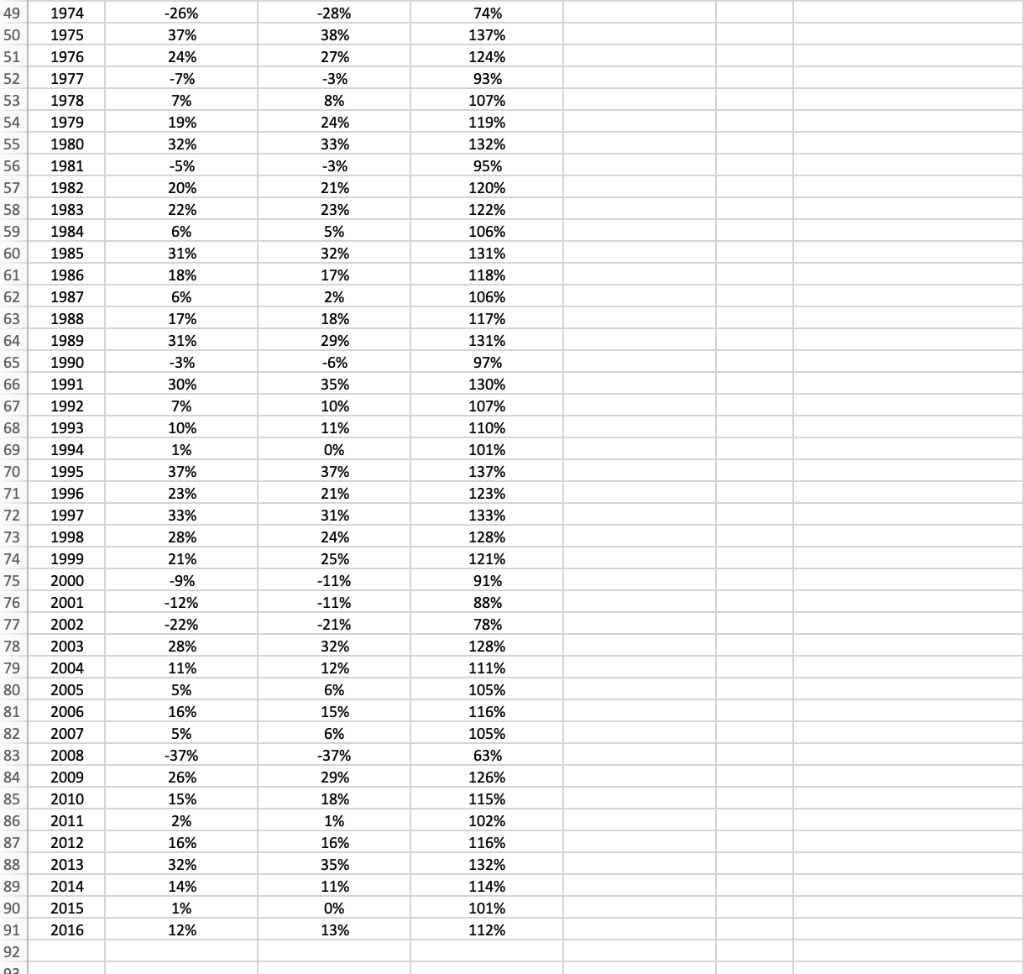
Please show how to compute the arithmetic average, geometric average, and standard deviation for both the S&P 500 Index and the Broad Market Index using excel. (Please show excel formulas and all work thoroughly)
Please explain the worded question as well.
E23 f A B D E F G H j K L M N o Q R S T U NP For the S&P 500 index and broad market (index of all NYSE/NASDAQ/AMEX stocks) calculate the average return and standard deviation of return. Annual returns for the years 1927-2016 are presented on the left. 3 4 Year 1927 1928 1929 1930 1931 1932 1933 1934 5 6 7 8 9 10 Broad Market Index Arithmetic Average Geometric Average Standard Deviation S&P 500 Index 11.69% #NUM! 19.76% 1935 11 How do these metrics compare between S&P 500 Index and the Broad Market Index? What do they say about the risk and return of the two indices? 12 13 14 1936 1937 1938 1939 S&P 500 Index 36% 44% -8% -25% -44% -9% 50% -1% 47% 32% -35% 29% -1% -11% -13% 19% 25% 19% 36% -8% 5% 6% 18% 31% 24% 18% Answer: 1940 15 16 17 1941 18 19 20 21 22 23 24 Broad Market Index 34% 38% -13% -28% -44% -8% 56% 5% 45% 33% -35% 28% 3% -7% -10% 16% 29% 21% 38% -6% 4% 2% 20% 29% 21% 14% 1% 50% 25% 8% -10% 45% 13% 1% 27% -10% 21% 16% 15% -9% 28% 14% -11% 1% 16% 17% -18% 1+spy500 136% 144% 92% 75% 56% 91% 150% 99% 147% 132% 65% 129% 99% 89% 87% 119% 125% 119% 136% 92% 105% 106% 118% 131% 124% 118% 99% 153% 133% 107% 90% 144% 112% 100% 127% 91% 123% 116% 112% 90% 124% 111% 92% 104% 114% 119% 86% 1942 1943 1944 1945 1946 1947 1948 1949 1950 1951 1952 1953 1954 1955 1956 1957 1958 1959 1960 1961 1962 25 26 27 28 29 30 31 32 33 34 35 36 37 38 39 1963 -1% 53% 33% 7% -10% 44% 12% 0% 27% -9% 23% 16% 12% -10% 24% 11% -8% 4% 14% 19% -14% 40 41 42 43 44 1964 1965 1966 1967 1968 1969 1970 1971 1972 1973 45 46 47 48 49 50 51 52 53 54 55 56 57 58 59 -28% 38% 27% -3% 8% 24% 74% 137% 124% 93% 107% 119% 132% 95% 120% 33% -3% 21% 23% 122% 60 61 62 63 -26% 37% 24% -7% 7% 19% 32% -5% 20% 22% 6% 31% 18% 6% 17% 31% -3% 30% 7% 10% 1% 37% 23% 33% 28% 21% -9% -12% -22% 28% 64 1974 1975 1976 1977 1978 1979 1980 1981 1982 1983 1984 1985 1986 1987 1988 1989 1990 1991 1992 1993 1994 1995 1996 1997 1998 1999 2000 2001 2002 2003 2004 2005 2006 5% 32% 17% 2% 18% 29% -6% 35% 10% 11% 0% 37% 65 66 67 68 69 21% 70 71 72 73 74 75 76 106% 131% 118% 106% 117% 131% 97% 130% 107% 110% 101% 137% 123% 133% 128% 121% 91% 88% 78% 128% 111% 105% 116% 105% 63% 126% 115% 102% 116% 132% 114% 101% 112% 77 31% 24% 25% -11% -11% -21% 32% 12% 6% 15% 6% -37% 29% 78 11% 2007 79 80 81 82 83 84 85 86 87 2008 2009 2010 2011 2012 2013 2014 2015 2016 5% 16% 5% -37% 26% 15% 2% 16% 32% 14% 88 18% 1% 16% 35% 11% 0% 13% 89 90 91 92 1% 12% E23 f A B D E F G H j K L M N o Q R S T U NP For the S&P 500 index and broad market (index of all NYSE/NASDAQ/AMEX stocks) calculate the average return and standard deviation of return. Annual returns for the years 1927-2016 are presented on the left. 3 4 Year 1927 1928 1929 1930 1931 1932 1933 1934 5 6 7 8 9 10 Broad Market Index Arithmetic Average Geometric Average Standard Deviation S&P 500 Index 11.69% #NUM! 19.76% 1935 11 How do these metrics compare between S&P 500 Index and the Broad Market Index? What do they say about the risk and return of the two indices? 12 13 14 1936 1937 1938 1939 S&P 500 Index 36% 44% -8% -25% -44% -9% 50% -1% 47% 32% -35% 29% -1% -11% -13% 19% 25% 19% 36% -8% 5% 6% 18% 31% 24% 18% Answer: 1940 15 16 17 1941 18 19 20 21 22 23 24 Broad Market Index 34% 38% -13% -28% -44% -8% 56% 5% 45% 33% -35% 28% 3% -7% -10% 16% 29% 21% 38% -6% 4% 2% 20% 29% 21% 14% 1% 50% 25% 8% -10% 45% 13% 1% 27% -10% 21% 16% 15% -9% 28% 14% -11% 1% 16% 17% -18% 1+spy500 136% 144% 92% 75% 56% 91% 150% 99% 147% 132% 65% 129% 99% 89% 87% 119% 125% 119% 136% 92% 105% 106% 118% 131% 124% 118% 99% 153% 133% 107% 90% 144% 112% 100% 127% 91% 123% 116% 112% 90% 124% 111% 92% 104% 114% 119% 86% 1942 1943 1944 1945 1946 1947 1948 1949 1950 1951 1952 1953 1954 1955 1956 1957 1958 1959 1960 1961 1962 25 26 27 28 29 30 31 32 33 34 35 36 37 38 39 1963 -1% 53% 33% 7% -10% 44% 12% 0% 27% -9% 23% 16% 12% -10% 24% 11% -8% 4% 14% 19% -14% 40 41 42 43 44 1964 1965 1966 1967 1968 1969 1970 1971 1972 1973 45 46 47 48 49 50 51 52 53 54 55 56 57 58 59 -28% 38% 27% -3% 8% 24% 74% 137% 124% 93% 107% 119% 132% 95% 120% 33% -3% 21% 23% 122% 60 61 62 63 -26% 37% 24% -7% 7% 19% 32% -5% 20% 22% 6% 31% 18% 6% 17% 31% -3% 30% 7% 10% 1% 37% 23% 33% 28% 21% -9% -12% -22% 28% 64 1974 1975 1976 1977 1978 1979 1980 1981 1982 1983 1984 1985 1986 1987 1988 1989 1990 1991 1992 1993 1994 1995 1996 1997 1998 1999 2000 2001 2002 2003 2004 2005 2006 5% 32% 17% 2% 18% 29% -6% 35% 10% 11% 0% 37% 65 66 67 68 69 21% 70 71 72 73 74 75 76 106% 131% 118% 106% 117% 131% 97% 130% 107% 110% 101% 137% 123% 133% 128% 121% 91% 88% 78% 128% 111% 105% 116% 105% 63% 126% 115% 102% 116% 132% 114% 101% 112% 77 31% 24% 25% -11% -11% -21% 32% 12% 6% 15% 6% -37% 29% 78 11% 2007 79 80 81 82 83 84 85 86 87 2008 2009 2010 2011 2012 2013 2014 2015 2016 5% 16% 5% -37% 26% 15% 2% 16% 32% 14% 88 18% 1% 16% 35% 11% 0% 13% 89 90 91 92 1% 12%
Step by Step Solution
There are 3 Steps involved in it

Get step-by-step solutions from verified subject matter experts