

Question: Please show how to create the graph in excel and find the breakeven points. 10. In mid-May, there are two outstanding call option contracts available
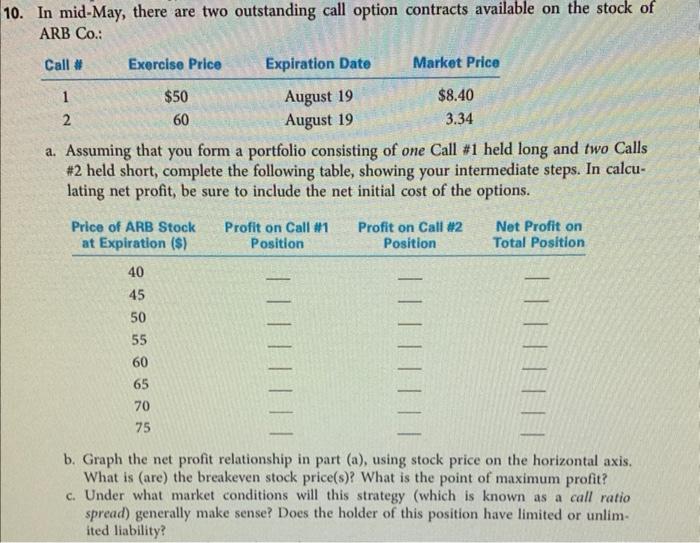
10. In mid-May, there are two outstanding call option contracts available on the stock of ARB Co.: 1 Call # Exercise Price Expiration Date Market Price $50 August 19 $8.40 2 60 August 19 3.34 a. Assuming that you form a portfolio consisting of one Call #1 held long and two Calls #2 held short, complete the following table, showing your intermediate steps. In calcu- lating net profit, be sure to include the net initial cost of the options. Price of ARB Stock at Expiration ($) Profit on Call #1 Position Profit on Call #2 Position Net Profit on Total Position 40 45 50 55 60 65 70 75 b. Graph the net profit relationship in part (a), using stock price on the horizontal axis. What is (are) the breakeven stock price(s)? What is the point of maximum profit? c. Under what market conditions will this strategy (which is known as a call ratio spread) generally make sense? Does the holder of this position have limited or unlim- ited liability
Step by Step Solution
There are 3 Steps involved in it

Get step-by-step solutions from verified subject matter experts