Question: Please show how to do charts, equations, and formulas, thank you! a. Develop a scatter chart with weight as the independent variable. What does the

Please show how to do charts, equations, and formulas, thank you! Please show how to do charts, equations, and
a. Develop a scatter chart with weight as the independent variable. What does the scatter chart indicate about the relationship between the weight and price of these bicycles? b. Use the data to develop an estimated regression equation that could be used to estimate the price for a bicycle, given its weight. What is the estimated regression model? c. Test whether each of the regression parameters 0 and 1 is equal to zero at a 0.05 level of significance. What are the correct interpretations of the estimated regression parameters? Are these interpretations reasonable? d. How much of the variation in the prices of the bicycles in the sample does the regression model you estimated in part (b) explain

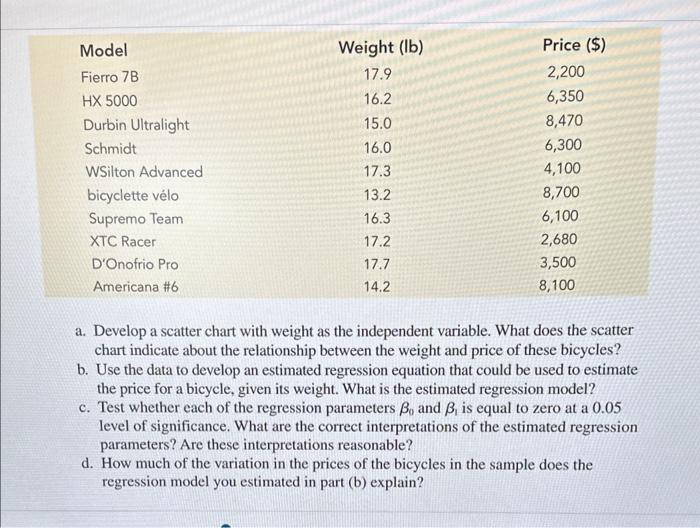
Step by Step Solution

There are 3 Steps involved in it

1 Expert Approved Answer
Step: 1 Unlock blur-text-image
Question Has Been Solved by an Expert!

Get step-by-step solutions from verified subject matter experts

Step: 2 Unlock
Step: 3 Unlock

Students Have Also Explored These Related General Management Questions!