

Question: please show how to do excel 1) Perform the following on the NFL Passing]datafile attached (label your answers so that I know where to find
![NFL Passing]datafile attached (label your answers so that I know where to](https://dsd5zvtm8ll6.cloudfront.net/si.experts.images/questions/2024/10/671d18df107a9_158671d18de93b68.jpg)
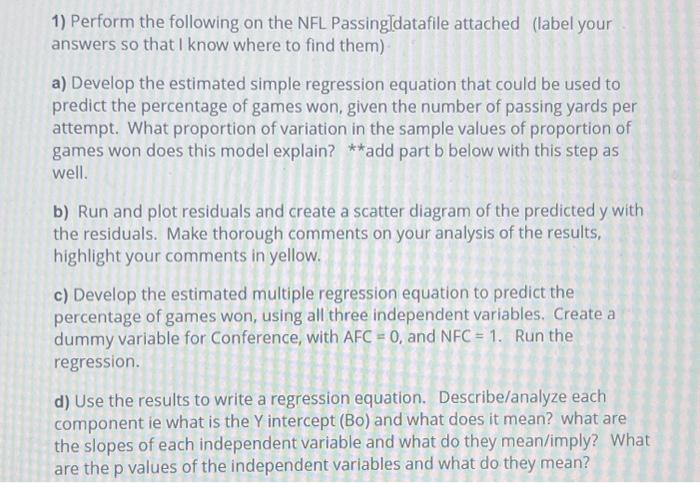
1) Perform the following on the NFL Passing]datafile attached (label your answers so that I know where to find them) a) Develop the estimated simple regression equation that could be used to predict the percentage of games won, given the number of passing yards per attempt. What proportion of variation in the sample values of proportion of games won does this model explain? **add part b below with this step as well. b) Run and plot residuals and create a scatter diagram of the predicted y with the residuals. Make thorough comments on your analysis of the results, highlight your comments in yellow. c) Develop the estimated multiple regression equation to predict the percentage of games won, using all three independent variables. Create a dummy variable for Conference, with \\( A F C=0 \\), and \\( N F C=1 \\). Run the regression. d) Use the results to write a regression equation. Describe/analyze each component ie what is the \\( Y \\) intercept \\( (\\mathrm{Bo}) \\) and what does it mean? what are the slopes of each independent variable and what do they mean/imply? What are the \\( p \\) values of the independent variables and what do they mean?
Step by Step Solution
There are 3 Steps involved in it

Get step-by-step solutions from verified subject matter experts