

Question: please show how to do the forecasting in excel, written reports not needed You havejust started your intemship with the XYZ consulting company located in
please show how to do the forecasting in excel, written reports not needed
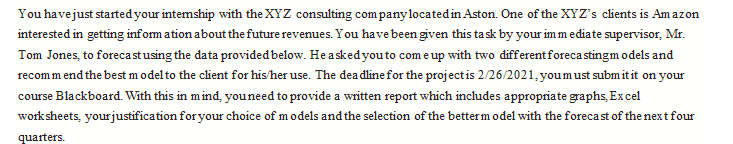
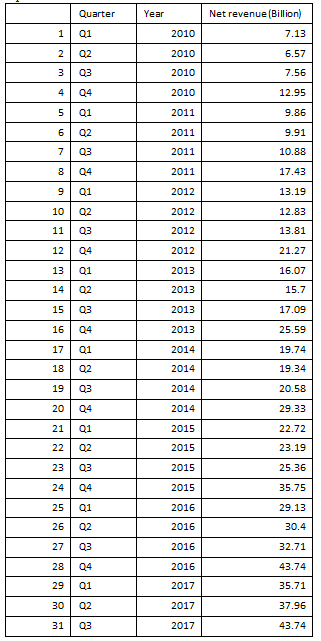
You havejust started your intemship with the XYZ consulting company located in Aston. One of the XYZ's clients is Amazon interested in getting information about the future revenues. You have been given this task by your immediate supervisor, Mr. Tom Jones, to forecast using the data provided below. He asked you to come up with two different forecastingmodels and recommend the best model to the client for his/her use. The deadline for the projectis 2/26/2021, youmust submit it on your course Blackboard. With this in mind, you need to provide a written report which includes appropriate graphs, Excel worksheets, yourjustification for your choice of models and the selection of the better model with the forecast of the next four quarters Quarter Year Net revenue (Billion) 1 Q1 2010 7.13 2 02 2010 6.57 7.56 3 03 2010 04 2010 12.95 5 01 2011 9.86 6 Q2 2011 9.91 7 03 2011 10.88 8 04 2011 17.43 9 Q1 2012 13.19 10 02 2012 12.83 11 03 2012 13.81 12 04 2012 21.27 13 01 2013 16.07 14 Q2 2013 15.7 15 03 2013 17.09 16 2013 25.59 17 Q1 2014 19.74 18 02 2014 19.34 19 03 2014 20.58 20 04 2014 29.33 21 Q1 2015 22.72 22 Q2 2015 23.19 23 Q3 2015 25.36 24 04 2015 35.75 25 Q1 2016 29.13 26 02 2016 30.4 27 03 2016 32.71 28 04 2016 43.74 29 Q1 2017 35.71 30 Q2 2017 37.96 31 Q3 2017 43.74 You havejust started your intemship with the XYZ consulting company located in Aston. One of the XYZ's clients is Amazon interested in getting information about the future revenues. You have been given this task by your immediate supervisor, Mr. Tom Jones, to forecast using the data provided below. He asked you to come up with two different forecastingmodels and recommend the best model to the client for his/her use. The deadline for the projectis 2/26/2021, youmust submit it on your course Blackboard. With this in mind, you need to provide a written report which includes appropriate graphs, Excel worksheets, yourjustification for your choice of models and the selection of the better model with the forecast of the next four quarters Quarter Year Net revenue (Billion) 1 Q1 2010 7.13 2 02 2010 6.57 7.56 3 03 2010 04 2010 12.95 5 01 2011 9.86 6 Q2 2011 9.91 7 03 2011 10.88 8 04 2011 17.43 9 Q1 2012 13.19 10 02 2012 12.83 11 03 2012 13.81 12 04 2012 21.27 13 01 2013 16.07 14 Q2 2013 15.7 15 03 2013 17.09 16 2013 25.59 17 Q1 2014 19.74 18 02 2014 19.34 19 03 2014 20.58 20 04 2014 29.33 21 Q1 2015 22.72 22 Q2 2015 23.19 23 Q3 2015 25.36 24 04 2015 35.75 25 Q1 2016 29.13 26 02 2016 30.4 27 03 2016 32.71 28 04 2016 43.74 29 Q1 2017 35.71 30 Q2 2017 37.96 31 Q3 2017 43.74
Step by Step Solution
There are 3 Steps involved in it

Get step-by-step solutions from verified subject matter experts