Question: please show how to find the answer for upper and lower control limits for one of the samples 1. Use the following observations and plot

please show how to find the answer for upper and lower control limits for one of the samples please show how to find the answer for upper and
1. Use the following observations and plot control charts. You are required to compute mean and range of each sample, lower and upper control limits. Describe if the process is in control or not and what could be assignable causes Sample 1 2 3 4 5 6 7 8 9 10 11 12 2.05 7.21 3.12 2.96 3.25 5.47 6.05 1.87 3.33 2.61 3.52 3.18 OBSERVATIONS 6.27 1.5 5.11 3.81 3.11 2.98 2.03 2.65 4.15 2.15 5.66 11.73 1.35 2.56 2.66 3.45 1.37 5.2 4.15 5.01 1.63 1.29 2.15 1.88 3.17 3.18 1.98 2.74 8.06 2.98 3.8 3.05 1.18 3.45 2.06 1.15 1.05 3.78 2.65 2.15 3.74 4.95 2.34 3.63 3.05 3.16 2.07 3.11

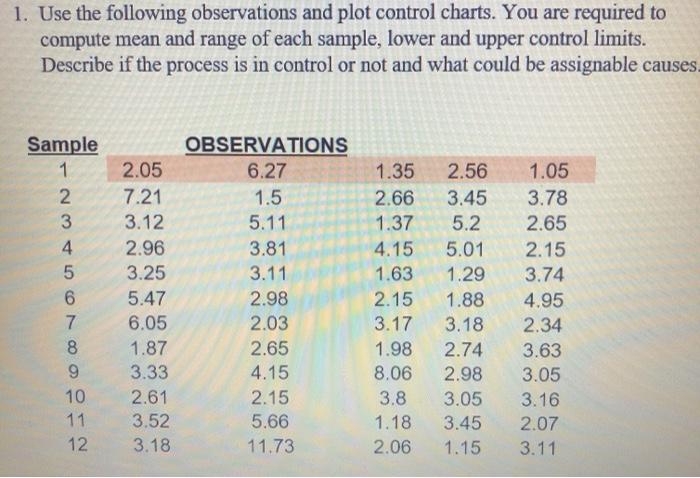
Step by Step Solution

There are 3 Steps involved in it

1 Expert Approved Answer
Step: 1 Unlock blur-text-image
Question Has Been Solved by an Expert!

Get step-by-step solutions from verified subject matter experts

Step: 2 Unlock
Step: 3 Unlock

Students Have Also Explored These Related General Management Questions!