

Question: Please show how to setup problem in excel or other stat software so it can be solved: Part I The average number of strokes for
Please show how to setup problem in excel or other stat software so it can be solved:
Part I
The average number of strokes for a tool is 45,000.
The standard deviation is 2,500 strokes.
A punch has a total of 25 mm that can be ground off before it is no longer useful.
Each regrind to sharpen a punch removes 1 mm of punch life.
The cost to regrind is:
2 hours of press downtime to remove and reinsert tool, at $300 per hour
5 hours of tool maintenance time, at $65 per hour
5 hours of downtime while press is not being used, at $300 per hour
The average wait time for unplanned tool regrind is 15 hours at $300 per hour.
Because of the large number of strokes per tool regrind, this is considered to be a continuous distribution. The normal curve probability distribution is applicable.
Part II
Using the data provided in Case Study Part I above, perform calculations to answer the following questions:
What is the probability that a tool will last?
52,000 strokes
41,000 strokes
45,000 strokes
Given the production life data provided in Case Study 9.2 in the text, answer the following questions:
What is the mean and standard deviation of the "production over life of tool"?
What is the probability that the "production over life of tool" will be:
1,200,000
875,000
1,042,000
Given your analysis of the questions in Part I of the case study, what is the probability that:
The tool will be pulled for regrind 20 times
The tool will be pulled for regrind 23 times
The tool will be pulled for regrind 18 times
The tool will be pulled for regrind 25 times
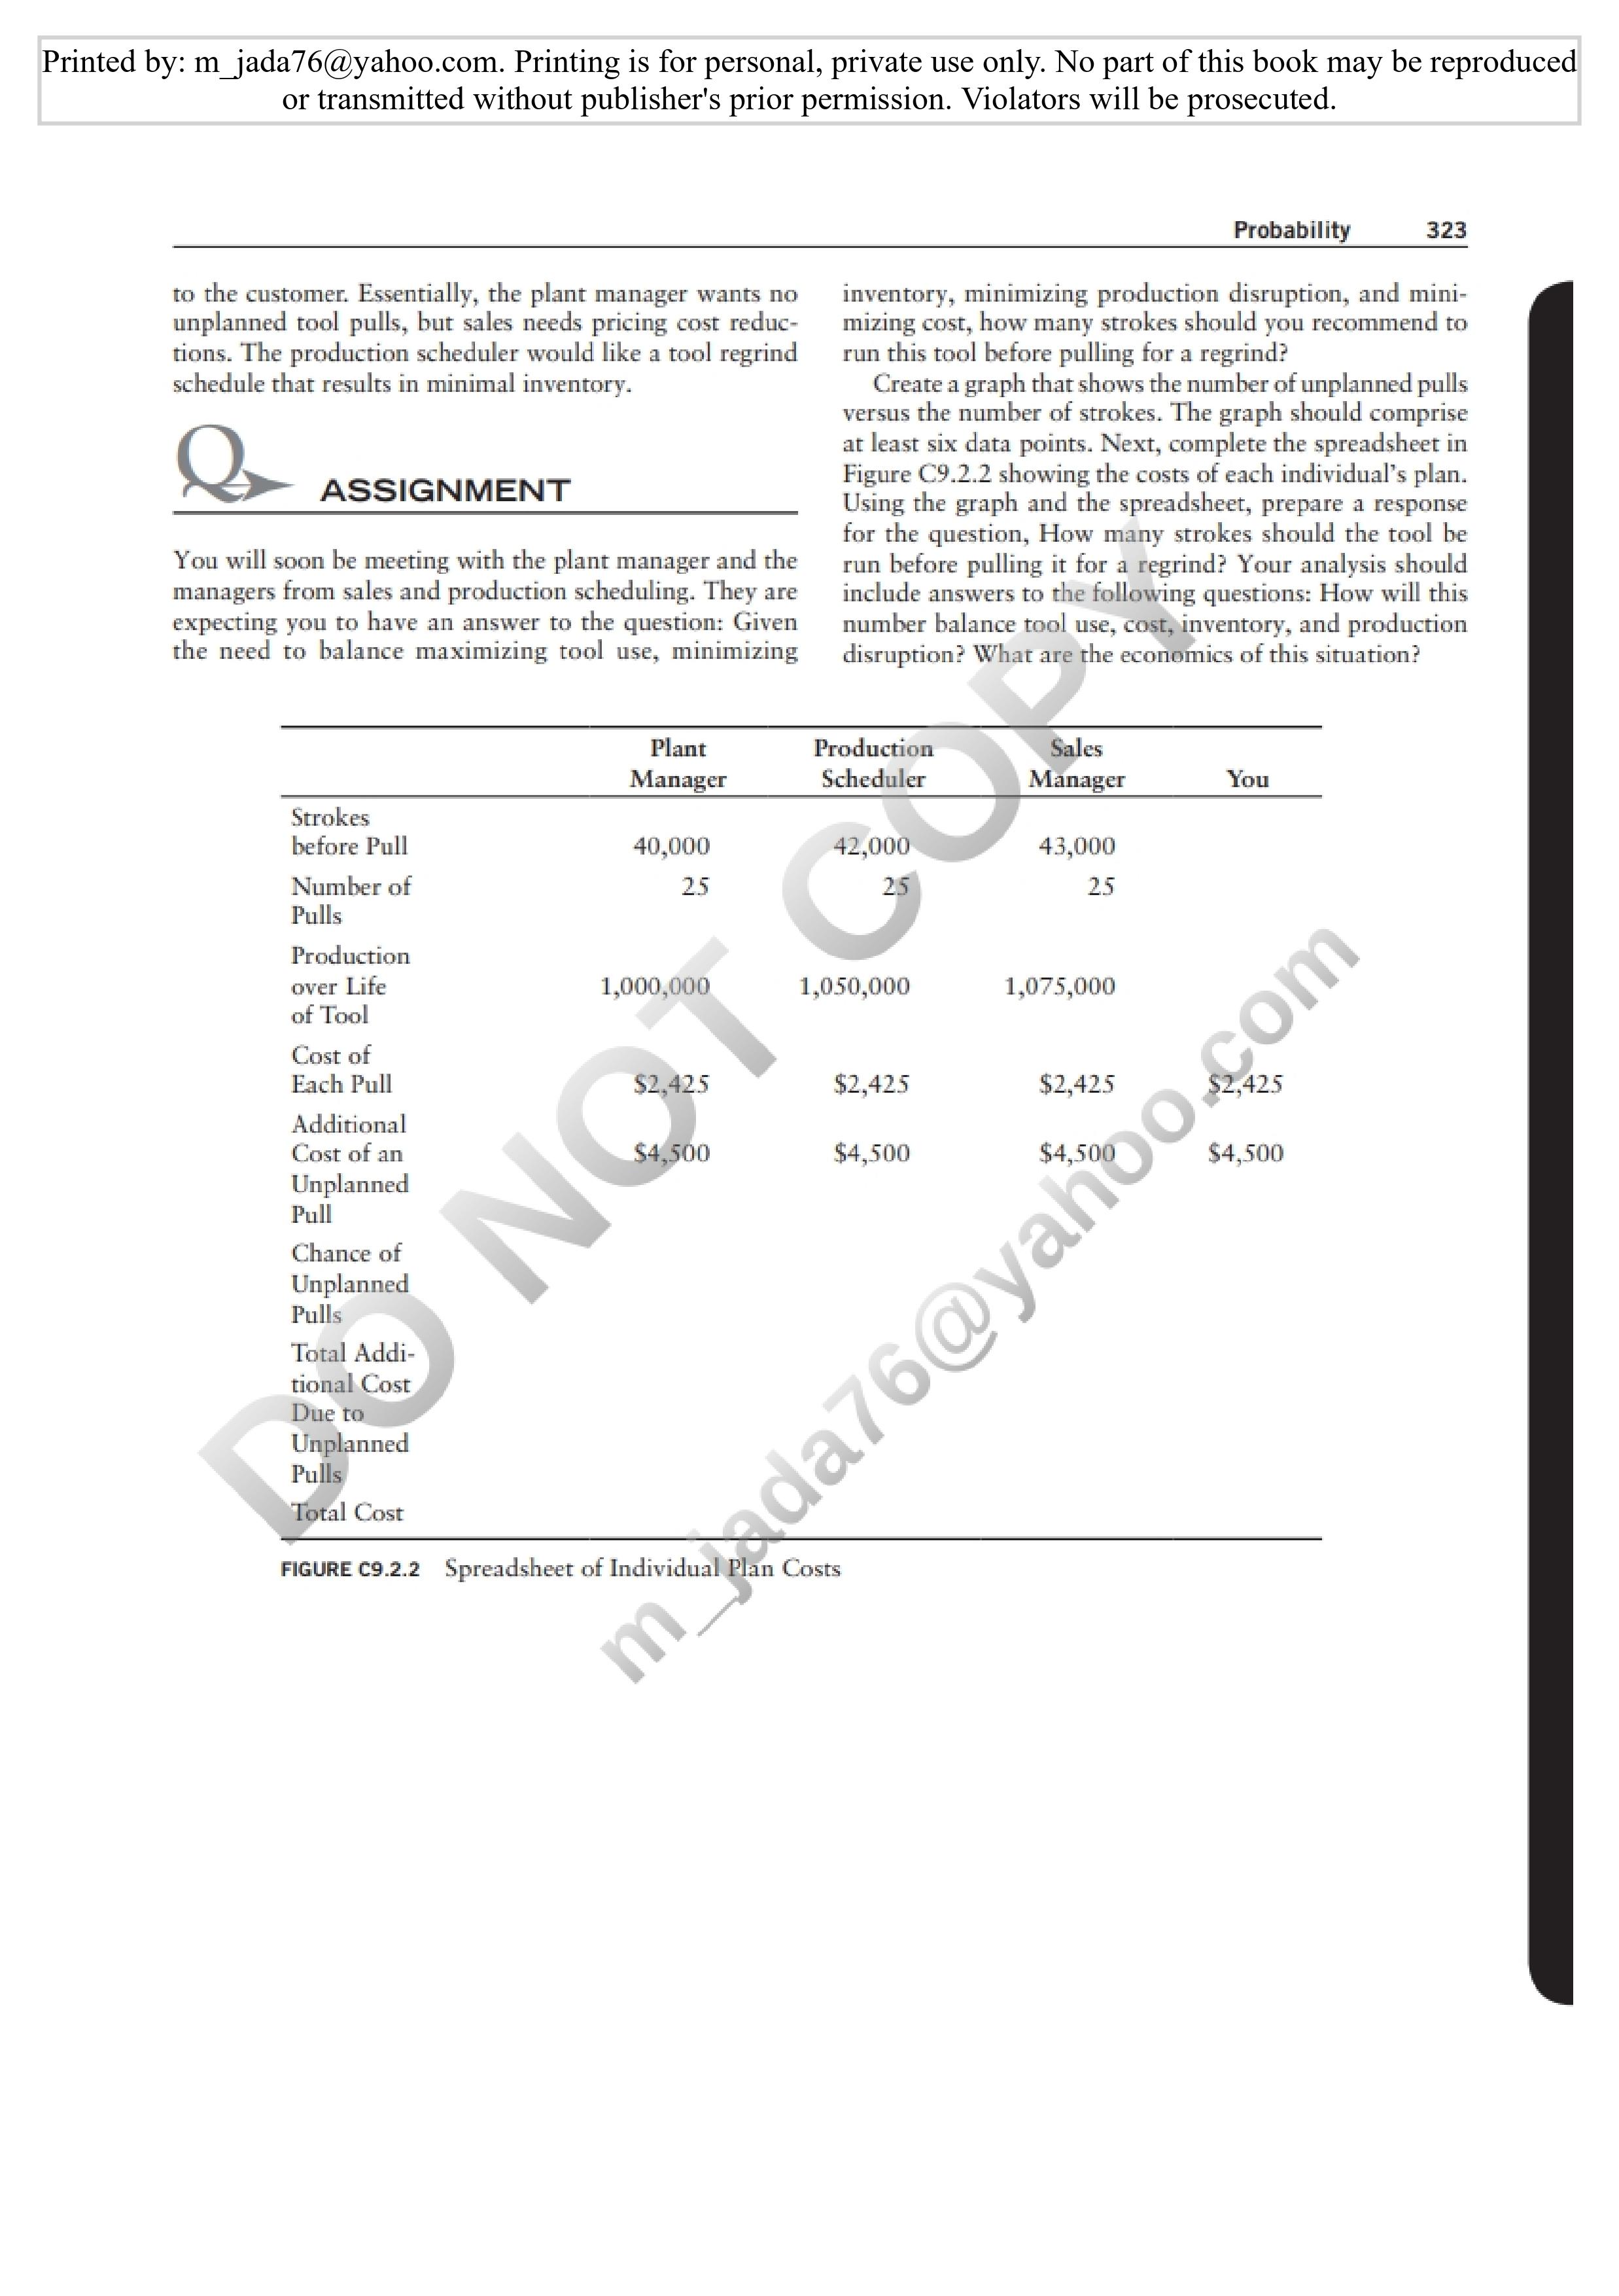
Printed by: m_jada76@yahoo.com. Printing is for personal, private use only. No part of this book may be reproduced or transmitted without publisher's prior permission. Violators will be prosecuted. CHAPTER NINE unexpectedly, the tool maintenance area may not have time CASE STUDY 9.2 to work on it immediately. Presses without tools don't run, and if they are not running, they are not making money. As the process engineer studying tool wear, you must Normal Probability Distribution develop a prediction for when the tool should be pulled This case is the first of three related cases found in Chap- and resharpened. ters 9, 10, and 13. These cases seek to link information The following information is available from the tool maintenance department. from the three chapters in order to resolve quality issues. Although they are related, it is not necessary to complete The average number of strokes for a tool is 45,000. the case in this chapter in order to understand or complete the cases in the following chapters. The standard deviation is 2,500 strokes. A punch has a total of 25 mm that can be ground off PART 1 before it is no longer useful. Max's B-B-Q Inc. manufactures top-of-the-line barbeque Each regrind to sharpen a punch removes 1 mm of tools. The tools include forks, spatulas, knives, spoons, punch life. and shish-kebab skewers. Max's fabricates both the metal The cost to regrind is parts of the tools and the resin handles. These are then riv- 2 hours of press downtime to remove and reinsert eted together to create the tools (Figure C9.2.1). Recently, tool, at $300 per hour Max's hired you as a process engineer. Your first assign- 5 hours of tool maintenance time, at $65 per hour ment is to study routine tool wear on the company's stamp- 5 hours of downtime while press is not being used, ing machine. In particular, you will be studying tool-wear at $300 per hour patterns for the tools used to create knife blades. The average wait time for unplanned tool regrind is In the stamping process, the tooling wears slightly 15 hours at $300 per hour. during each stroke of the press as the punch shears through the material. As the tool wears, the part fea- Because of the large number of strokes per tool tures become smaller. The knife has specifications of regrind, this is considered to be a continuous distri- 10 mm + 0.025 mm; undersized parts must be scrapped. bution. The normal curve probability distribution is The tool can be resharpened to bring the parts produced applicable. back into specification. To reduce manufacturing costs and simplify machine scheduling, it is critical to pull the tool and perform maintenance only when absolutely necessary. ASSIGNMENT It is very important for scheduling, costing, and quality purposes that the average number of strokes, or tool run One percent of the tools wear out very early in their length, be determined. Knowing the average number of expected productive life. Early tool wearout-and, thus, an strokes that can be performed by a tool enables routine unplanned tool pull-can be caused by a variety of factors, maintenance to be scheduled. including changes in the hardness of the material being It is the plant manager's philosophy that tool main- punched, lack of lubrication, the hardness of the tool steel, tenance be scheduled proactively. When a tool is pulled and the width of the gap between the punch and the die. Key part dimensions are monitored using X and R charts. These charts reveal when the tool needs to be reground in order to preserve part quality. Use the normal probability distribution and the information provided to calculate the number of strokes that would result in an early wearout percentage of 1 percent or fewer. If the plant manager wants the tool to be pulled for a regrind at 40,000 strokes, what is the chance that there will be an early tool wearout failure before the tool reaches 40,000 strokes? PART 2 Now that you have been at Max's B-B-Q Inc. for a while, the plant manager asks you to assist the production sched- uling department with pricing data on a high volume job requiring knife blades for the company's best customer. As you know, it is the plant manager's philosophy to be proactive when scheduling tool maintenance (regrinds) FIGURE C9.2.1 Barbeque Tools rather than have to unexpectedly pull the tool. However, pricing will be a very important factor in selling this jobPrinted by: m_j ada76@yahoo.com. Printing is for personal, private use only. No part of this book may be reproduced. or transmitted Without publisher's prior permission. Vlolators will be prosecuted. Pruhabillty 323 to the customer. Essentially, the plant manager wants no unplanned tool pulls, but sales needs pricing cost reduc~ lions. The production scheduler would like a tool rye-grind schedule that results in minimal inventory. (L ASSIGNMENT You will soon be meeting with the plant manager and the managers from sales and production scheduling. They are expecting you to have an answer to the question: Given the need to balance maximizing tool use, minimizing Plant Manager Strokes before Pull Ntuttber of Pulls Production over Life of Tool Cost of Each Pull Additional Cost of an Unplanned Pull Chance of Unplanned Pulls Total Addi.' ' 40,800 25 inventory, minimizing production disruption, and mini- mizing cost, how many.' strokes should you recommend to run this tool before pulling for a regrind? Create a graph thatshows the number of unplanned pulls versus the number of strokes The graph should comprise at least six data points. Next, complete the spreadsheet in Figure (39.2.2. showbig the costs of each individual's plan. Using the graph and the spreadsheet, prepare a response for the question, How man}.T strokes should the tool be run before pulling it for a regrind? Your analysis should include answers to the following questions: Hon:r will this number balanoe tool use, mummy, and production disruption? What are the eco ics of this Situation? Production k. " es Module: \" get You 42.,000u ' 43,000 J 25 " s 1,050,000 1,075,000 , a\" $2,425 $2,425 $2,425 $4,500 54,500 J $4,500 "
Step by Step Solution
There are 3 Steps involved in it

Get step-by-step solutions from verified subject matter experts