

Question: please show how to show work on excel. Question 7 (25 points) Saved The National Association of Realtors maintains a database consisting of sales information
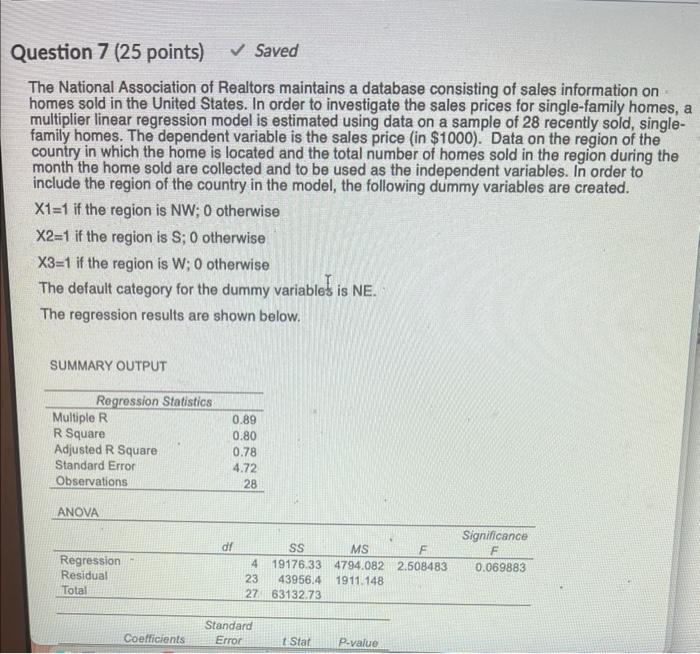
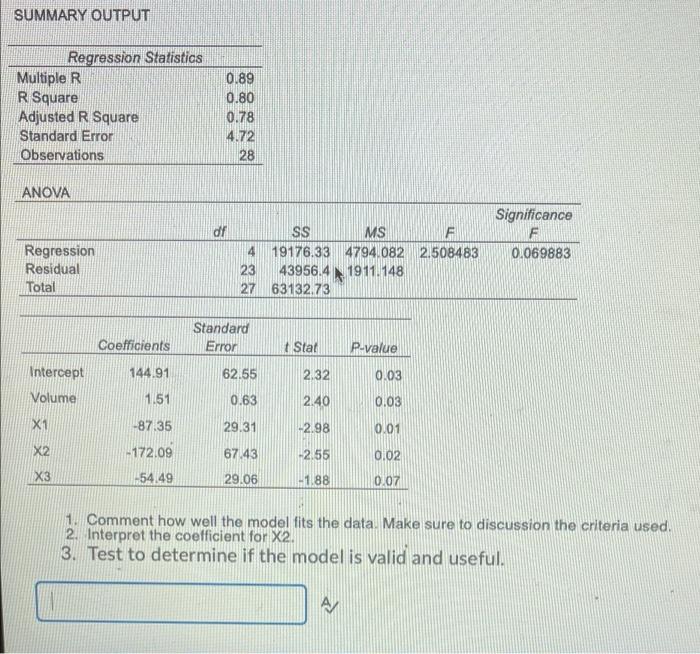
Question 7 (25 points) Saved The National Association of Realtors maintains a database consisting of sales information on homes sold in the United States. In order to investigate the sales prices for single-family homes, a multiplier linear regression model is estimated using data on a sample of 28 recently sold, single- family homes. The dependent variable is the sales price (in $1000). Data on the region of the country in which the home is located and the total number of homes sold in the region during the month the home sold are collected and to be used as the independent variables. In order to include the region of the country in the model, the following dummy variables are created. X1=1 if the region is NW; 0 otherwise X2=1 if the region is S; 0 otherwise X3=1 if the region is W; 0 otherwise The default category for the dummy variables is NE. The regression results are shown below. SUMMARY OUTPUT Regression Statistics Multiple R R Square Adjusted R Square Standard Error Observations 0.89 0.80 0.78 4.72 28 ANOVA d! Significance F 0.069883 SS MS F 419176.33 4794.082 2.508483 23 43956.4 1911.148 27 63132.73 Regression Residual Total Coefficients Standard Error 1 Stat P-value SUMMARY OUTPUT Regression Statistics Multiple R R Square Adjusted R Square Standard Error Observations 0.89 0.80 0.78 4.72 28 ANOVA df Significance F 0.069883 Regression Residual Total 4 23 27 SS MS F 19176.33 4794.082 2.508483 43956.4 N 1911.148 63132.73 Coefficients Standard Error Stat P-value 144.91 62.55 2.32 0.03 Intercept Volume 1.51 0.63 2.40 0.03 X1 -87.35 29.31 -2.98 0.01 X2 -172.09 67.43 -2.55 0.02 X3 -54 49 29.06 -1.88 0.07 1. Comment how well the model fits the data. Make sure to discussion the criteria used. 2. Interpret the coefficient for X2. 3. Test to determine if the model is valid and useful. AM
Step by Step Solution
There are 3 Steps involved in it

Get step-by-step solutions from verified subject matter experts