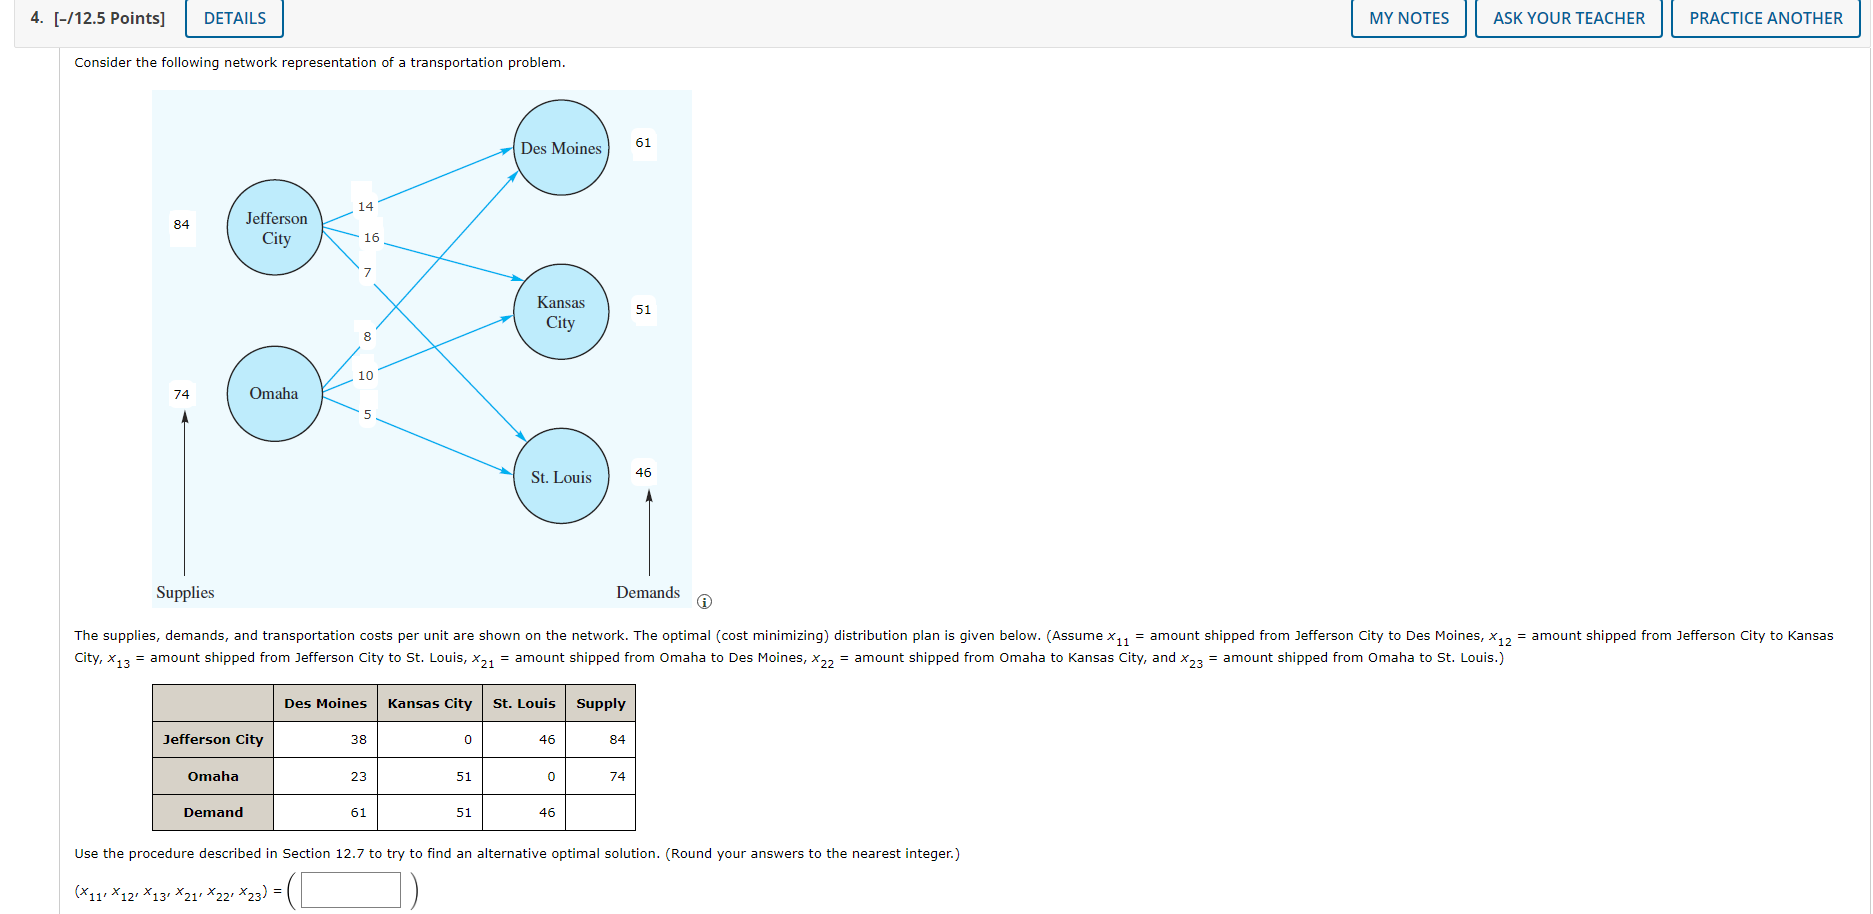
Question: Please show how to solve in Excel 4. [-/12.5 Points] DETAILS MY NOTES ASK YOUR TEACHER PRACTICE ANOTHER Consider the following network representation of a

Please show how to solve in Excel 4. [-/12.5Please show how to solve in Excel

4. [-/12.5 Points] DETAILS MY NOTES ASK YOUR TEACHER PRACTICE ANOTHER Consider the following network representation of a transportation problem. 61 Des Moines 14 84 Jefferson City 16 Kansas City 51 8 10 74 Omaha 5 St. Louis 46 Supplies Demands The supplies, demands, and transportation costs per unit are shown on the network. The optimal (cost minimizing) distribution plan is given below. (Assume X11 = amount shipped from Jefferson City to Des Moines, X12 = amount shipped from Jefferson City to Kansas City, *13 = amount shipped from Jefferson City to St. Louis, X21 = amount shipped from Omaha to Des Moines, *22 = amount shipped from Omaha to Kansas City, and X23 = amount shipped from Omaha to St. Louis.) Des Moines Kansas City St. Louis Supply Jefferson City 38 0 46 84 Omaha 23 51 0 74 Demand 61 51 46 Use the procedure described in Section 12.7 to try to find an alternative optimal solution. (Round your answers to the nearest integer.) *) *1 * 13) *21) *2) *23)= ([

Step by Step Solution

There are 3 Steps involved in it

1 Expert Approved Answer
Step: 1 Unlock blur-text-image
Question Has Been Solved by an Expert!

Get step-by-step solutions from verified subject matter experts

Step: 2 Unlock
Step: 3 Unlock

Students Have Also Explored These Related General Management Questions!