

Question: please show how to solve the questions shown using chart and data given. if possible please show how to solve in excel! Reler to Table
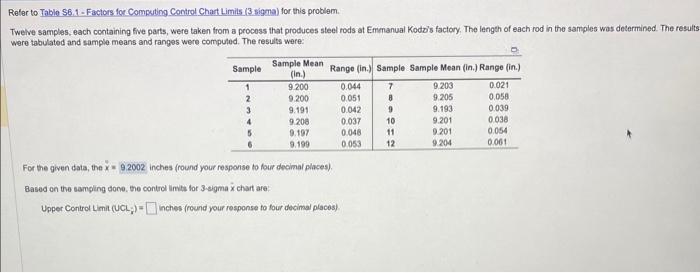
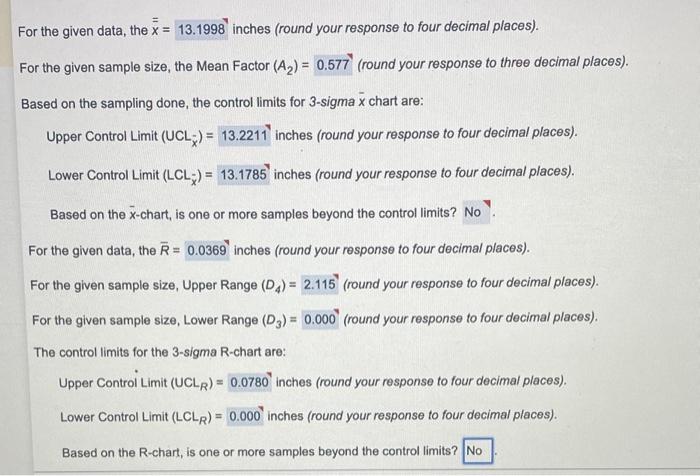
Reler to Table S8.1 - Factors for Competiog Control Chart Limils (3 sigma) for this problem. Tweive samples, each containing five parts, were taken from a process that produces steel rods at Emmanual Kodo's factory, The length of each rod in the samples was determined. The resulf were tabulated and sample means and ranges were compuled. The results were: For the given data, the x=92002 inches (round your response to four dhoinal places). Based on the sampling done, the control limts for 3 -sigma x chart are: Upper Control Limit (UCL)=inches (round your response to tour decimal placos) For the given data, the x= inches (round your response to four decimal places). For the given sample size, the Mean Factor (A2)=0.577 (round your response to three decimal places). Based on the sampling done, the control limits for 3 -sigma x chart are: Upper Control Limit (UCLx)= inches (round your response to four decimal places). Lower Control Limit (LCL)= inches (round your response to four decimal places). Based on the x-chart, is one or more samples beyond the control limits? For the given data, the R= inches (round your response to four decimal places). For the given sample size, Upper Range (D4)= (round your response to four decimal places). For the given sample size, Lower Range (D3)=0.000 (round your response to four decimal places). The control limits for the 3-sigma R-chart are: Upper Controi Limit (UCL UR ) =0.0780 inches (round your response to four decimal places). Lower Control Limit (LCLR)= inches (round your response to four decimal places). Based on the R-chart, is one or more samples beyond the control limits
Step by Step Solution
There are 3 Steps involved in it

Get step-by-step solutions from verified subject matter experts