

Question: Please show how to solve this problem using excel Higgs Bassoon Corporation is a custom manufacturer of bassoons and other wind instruments. Its current value
Please show how to solve this problem using excel
Higgs Bassoon Corporation is a custom manufacturer of bassoons and other wind instruments. Its current value of operations, which is also its value of debt plus equity, is estimated to be $200 million. Higgs has $110 million face value, zero coupon debt that is due in 3 years. The risk-free rate is 5%, and the standard deviation of returns for similar companies is 60%. The owners of Higgs Bassoon view their equity investment as an option and would like to know the value of their investment.
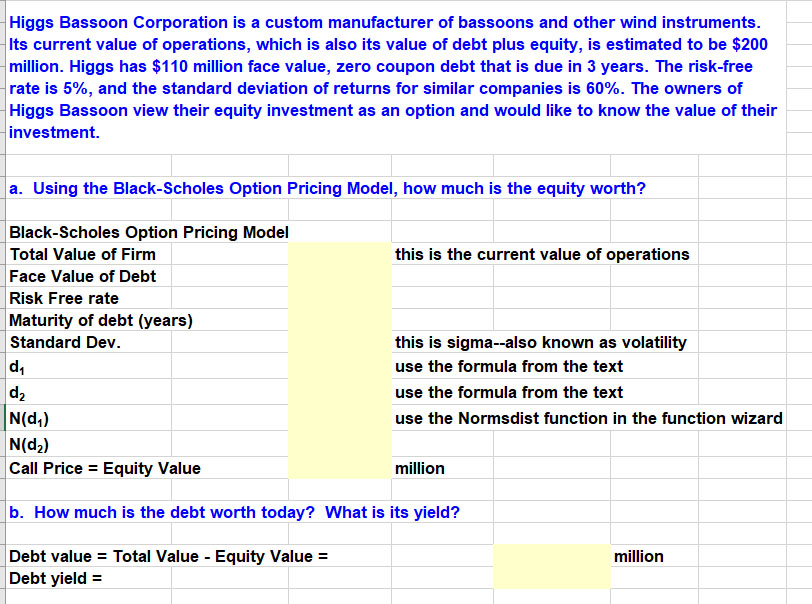
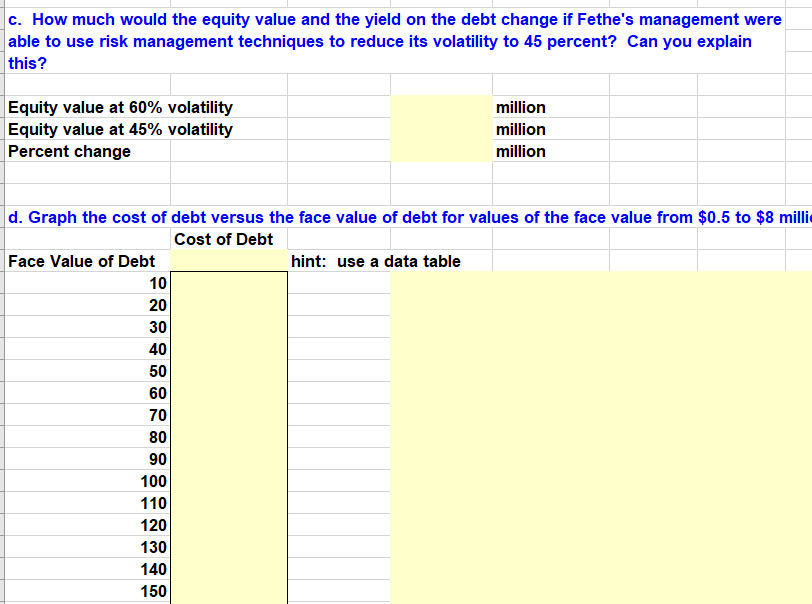
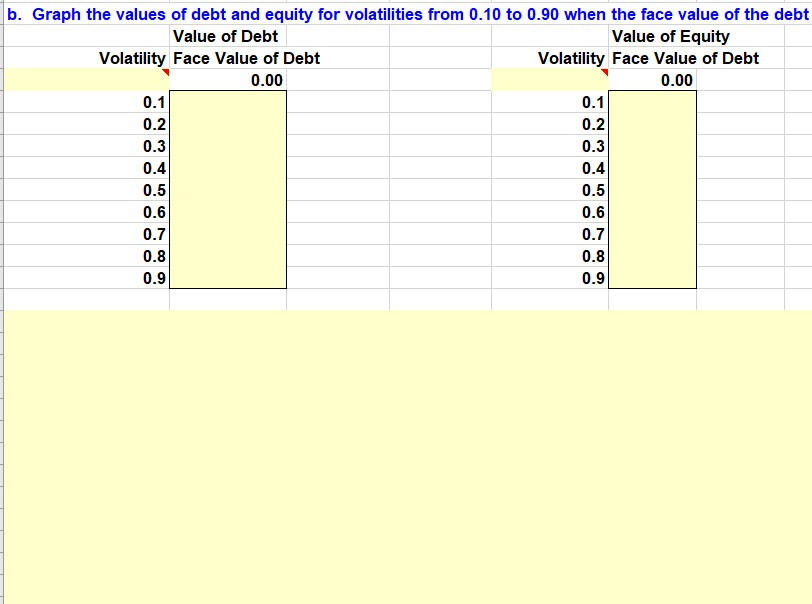
Higgs Bassoon Corporation is a custom manufacturer of bassoons and other wind instruments. Its current value of operations, which is also its value of debt plus equity, is estimated to be $200 million. Higgs has $110 million face value, zero coupon debt that is due in 3 years. The risk-free rate is 5%, and the standard deviation of returns for similar companies is 60%. The owners of Higgs Bassoon view their equity investment as an option and would like to know the value of their investment a. Using the Black-Scholes Option Pricing Model, how much is the equity worth? this is the current value of operations Black-Scholes Option Pricing Model Total Value of Firm Face Value of Debt Risk Free rate Maturity of debt (years) Standard Dev. di d N(d) N(d) Call Price = Equity Value this is sigma--also known as volatility use the formula from the text use the formula from the text use the Normsdist function in the function wizard million b. How much is the debt worth today? What is its yield? million Debt value = Total Value - Equity Value = Debt yield = c. How much would the equity value and the yield on the debt change if Fethe's management were able to use risk management techniques to reduce its volatility to 45 percent? Can you explain this? Equity value at 60% volatility Equity value at 45% volatility Percent change million million million d. Graph the cost of debt versus the face value of debt for values of the face value from $0.5 to $8 milli Cost of Debt Face Value of Debt hint: use a data table 10 20 30 40 50 60 70 80 90 100 110 120 130 140 150 b. Graph the values of debt and equity for volatilities from 0.10 to 0.90 when the face value of the debt Value of Debt Value of Equity Volatility Face Value of Debt Volatility Face Value of Debt 0.00 0.00 0.1 0.1 0.2 0.2 0.3 0.3 0.4 0.4 0.5 0.5 0.6 0.6 0.7 0.7 0.8 0.8 0.9 0.9
Step by Step Solution
There are 3 Steps involved in it

Get step-by-step solutions from verified subject matter experts