

Question: Please show how you get answer using Excel ! provided in the Think of any retailer that operates many stores throughout the country. The retailer
Please show how you get answer using Excel !
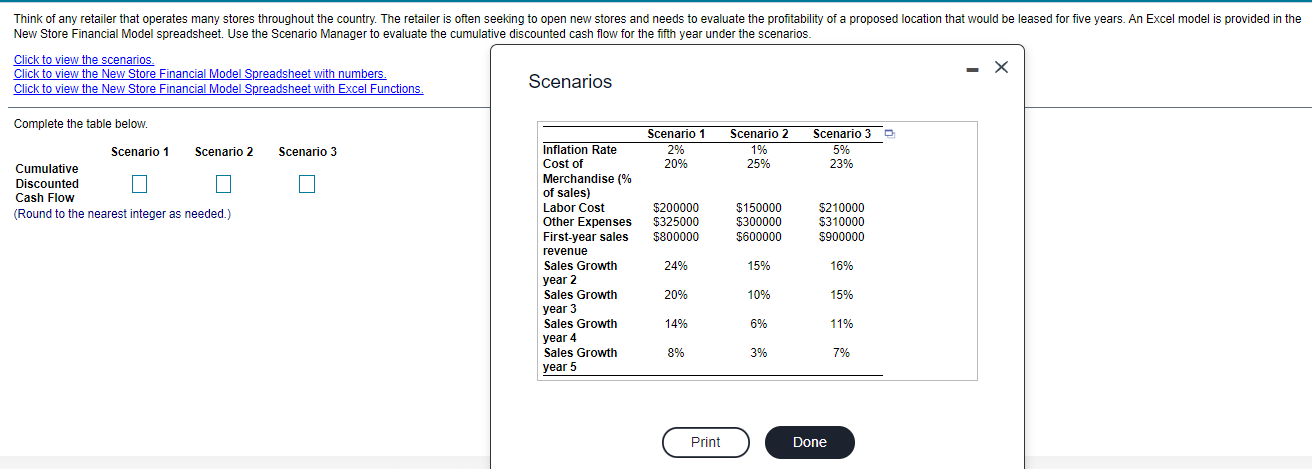
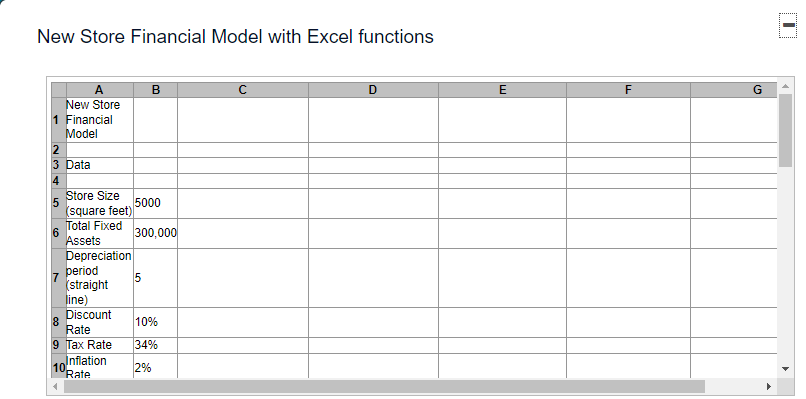
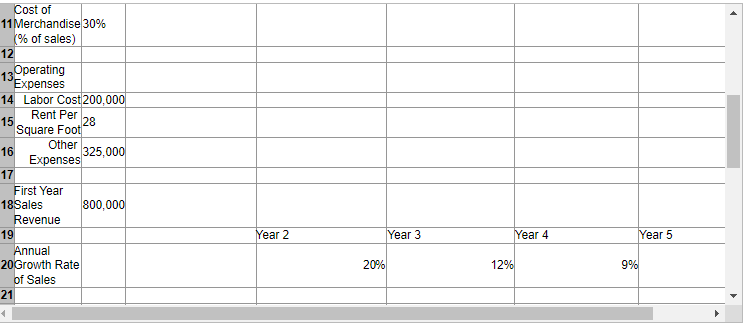
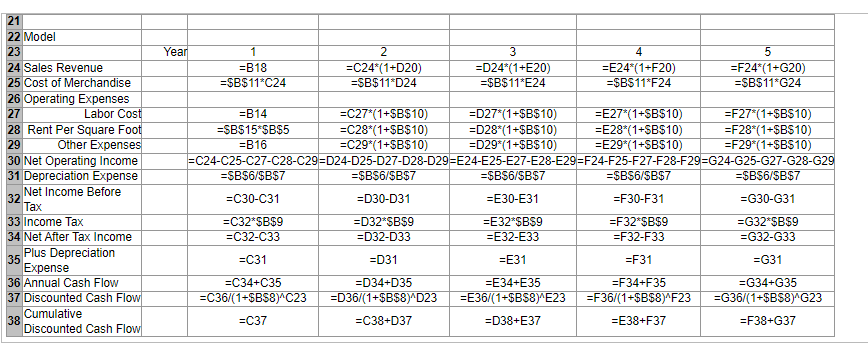
provided in the Think of any retailer that operates many stores throughout the country. The retailer is often seeking to open new stores and needs to evaluate the profitability of a proposed location that would be leased for five years. An Excel model New Store Financial Model spreadsheet. Use the Scenario Manager to evaluate the cumulative discounted cash flow for the fifth year under the scenarios. Click to view the scenarios. Click to view the New Store Financial Model Spreadsheet with numbers. - X Click to view the New Store Financial Model Spreadsheet with Excel Functions. Scenarios Complete the table below. D Scenario 3 Scenario 1 2% 20% Scenario 2 1% 25% Scenario 3 5% 23% Scenario 1 Scenario 2 Cumulative Discounted Cash Flow (Round to the nearest integer as needed.) Inflation Rate Cost of Merchandise % of sales) Labor Cost Other Expenses First-year sales revenue Sales Growth year 2 Sales Growth year 3 Sales Growth $200000 $325000 $800000 $150000 $300000 $600000 $210000 $310000 $900000 24% 15% 16% 20% 10% 15% 14% 6% 11% year 4 Sales Growth 8% 3% 7% year 5 Print Done New Store Financial Model with Excel functions D E F G B New Store 1 Financial Model 2 3 Data 4 Store Size 5 5000 (square feet) Total Fixed 6 300,000 Assets Depreciation 7 period 5 (straight line) Discount 10% Rate 9 Tax Rate 34% Inflation 10 2% Rate Cost of 11 Merchandise 30% % of sales) 12 13 Operating Expenses 14 Labor Cost 200,000 15 Rent Per 28 Square Foot Other 16 325,000 Expenses 17 First Year 18Sales 800,000 Revenue 19 Annual 20Growth Rate of Sales 21 Year 2 Year 3 Year 4 Year 5 20% 12% 9% Year 1 =B18 =$B$11C24 2 =C24*(1+D20) =$B$11D24 3 =D24*(1 +E20) =$B$11* E24 4 =E24*(1+F20) =$BS11*F24 5 =F24*(1+G20) =SB$11*G24 21 22 Model 23 24 Sales Revenue 25 Cost of Merchandise 26 Operating Expenses 27 Labor Cost 28 Rent Per Square Foot 29 Other Expenses 30 Net Operating Income 31 Depreciation Expense Net Income Before 32 Tax 33 Income Tax 34 Net After Tax Income Plus Depreciation 35 Expense 36 Annual Cash Flow 37 Discounted Cash Flow Cumulative 38 Discounted Cash Flow =B14 =C27*(1+$B$10) =D27*(1+$B$10) =E27*(1+$B$10) =F27*(1+$B$10) =SB$15*$B$5 =C28*(1+$B$10) =D28*(1+$B$10) =E28*(1+$B$10) =F28*(1+$B$10) =B16 =C29*(1+$B$10) =D29*(1+$B$10) =E29"(1+$B$10) =F29*(1+$BS10) =C24-C25-C27-C28-C29=D24-D25-D27-D28-D29=E24-E25-E27-E28-E29=F24-F25-F27-F28-F29=G24-G25-G27-G28-G29 =SBS6/$B$7 =$B$6/$B$7 =$B$6/$B$7 =$B$6/$B$7 =SBS6/$B$7 =C30-C31 =D30-D31 =E30-E31 =F30-F31 =G30-G31 =C32*$B$9 =D32*SB$9 =E32*$BS9 =F32*$B$9 =G32 SB$9 =C32-C33 =D32-D33 =E32-E33 =F32-F33 =G32-G33 =C31 =D31 =E31 =F31 =G31 =C34+C35 =C36/(1+$B$8) C23 =C37 =D34+D35 =D36/(1+$B$8) D23 =C38+D37 =E34+E35 =E36/(1+$B$8) E23 =D38+E37 =F34+F35 =F36/(1+$B$8)"F23 =E38+F37 =G34+G35 =G36/(1+$B$8) G23 =F38+G37 provided in the Think of any retailer that operates many stores throughout the country. The retailer is often seeking to open new stores and needs to evaluate the profitability of a proposed location that would be leased for five years. An Excel model New Store Financial Model spreadsheet. Use the Scenario Manager to evaluate the cumulative discounted cash flow for the fifth year under the scenarios. Click to view the scenarios. Click to view the New Store Financial Model Spreadsheet with numbers. - X Click to view the New Store Financial Model Spreadsheet with Excel Functions. Scenarios Complete the table below. D Scenario 3 Scenario 1 2% 20% Scenario 2 1% 25% Scenario 3 5% 23% Scenario 1 Scenario 2 Cumulative Discounted Cash Flow (Round to the nearest integer as needed.) Inflation Rate Cost of Merchandise % of sales) Labor Cost Other Expenses First-year sales revenue Sales Growth year 2 Sales Growth year 3 Sales Growth $200000 $325000 $800000 $150000 $300000 $600000 $210000 $310000 $900000 24% 15% 16% 20% 10% 15% 14% 6% 11% year 4 Sales Growth 8% 3% 7% year 5 Print Done New Store Financial Model with Excel functions D E F G B New Store 1 Financial Model 2 3 Data 4 Store Size 5 5000 (square feet) Total Fixed 6 300,000 Assets Depreciation 7 period 5 (straight line) Discount 10% Rate 9 Tax Rate 34% Inflation 10 2% Rate Cost of 11 Merchandise 30% % of sales) 12 13 Operating Expenses 14 Labor Cost 200,000 15 Rent Per 28 Square Foot Other 16 325,000 Expenses 17 First Year 18Sales 800,000 Revenue 19 Annual 20Growth Rate of Sales 21 Year 2 Year 3 Year 4 Year 5 20% 12% 9% Year 1 =B18 =$B$11C24 2 =C24*(1+D20) =$B$11D24 3 =D24*(1 +E20) =$B$11* E24 4 =E24*(1+F20) =$BS11*F24 5 =F24*(1+G20) =SB$11*G24 21 22 Model 23 24 Sales Revenue 25 Cost of Merchandise 26 Operating Expenses 27 Labor Cost 28 Rent Per Square Foot 29 Other Expenses 30 Net Operating Income 31 Depreciation Expense Net Income Before 32 Tax 33 Income Tax 34 Net After Tax Income Plus Depreciation 35 Expense 36 Annual Cash Flow 37 Discounted Cash Flow Cumulative 38 Discounted Cash Flow =B14 =C27*(1+$B$10) =D27*(1+$B$10) =E27*(1+$B$10) =F27*(1+$B$10) =SB$15*$B$5 =C28*(1+$B$10) =D28*(1+$B$10) =E28*(1+$B$10) =F28*(1+$B$10) =B16 =C29*(1+$B$10) =D29*(1+$B$10) =E29"(1+$B$10) =F29*(1+$BS10) =C24-C25-C27-C28-C29=D24-D25-D27-D28-D29=E24-E25-E27-E28-E29=F24-F25-F27-F28-F29=G24-G25-G27-G28-G29 =SBS6/$B$7 =$B$6/$B$7 =$B$6/$B$7 =$B$6/$B$7 =SBS6/$B$7 =C30-C31 =D30-D31 =E30-E31 =F30-F31 =G30-G31 =C32*$B$9 =D32*SB$9 =E32*$BS9 =F32*$B$9 =G32 SB$9 =C32-C33 =D32-D33 =E32-E33 =F32-F33 =G32-G33 =C31 =D31 =E31 =F31 =G31 =C34+C35 =C36/(1+$B$8) C23 =C37 =D34+D35 =D36/(1+$B$8) D23 =C38+D37 =E34+E35 =E36/(1+$B$8) E23 =D38+E37 =F34+F35 =F36/(1+$B$8)"F23 =E38+F37 =G34+G35 =G36/(1+$B$8) G23 =F38+G37
Step by Step Solution
There are 3 Steps involved in it

Get step-by-step solutions from verified subject matter experts