

Question: please show how you got it-- the equations in excel 8/3/15 Chapter: Problem: 12 11 Start with the partial model in the file Ch12 P11
 please show how you got it-- the equations in excel
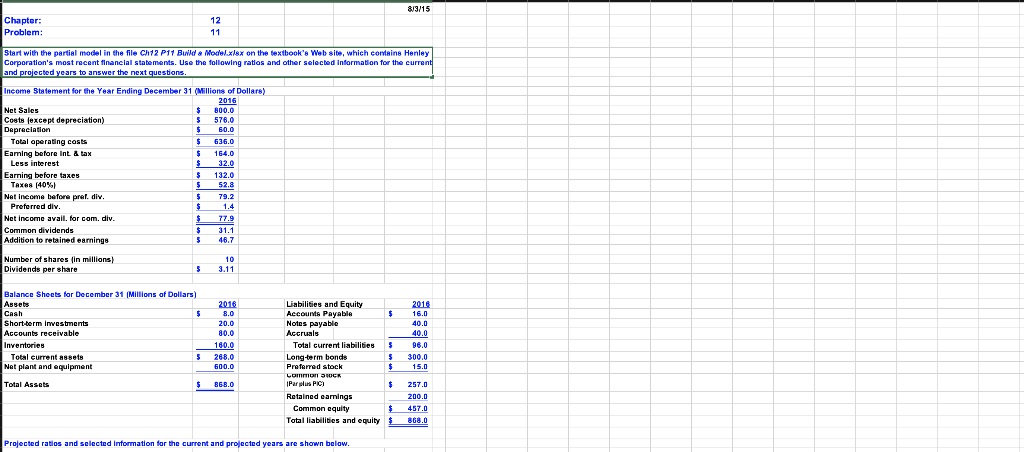
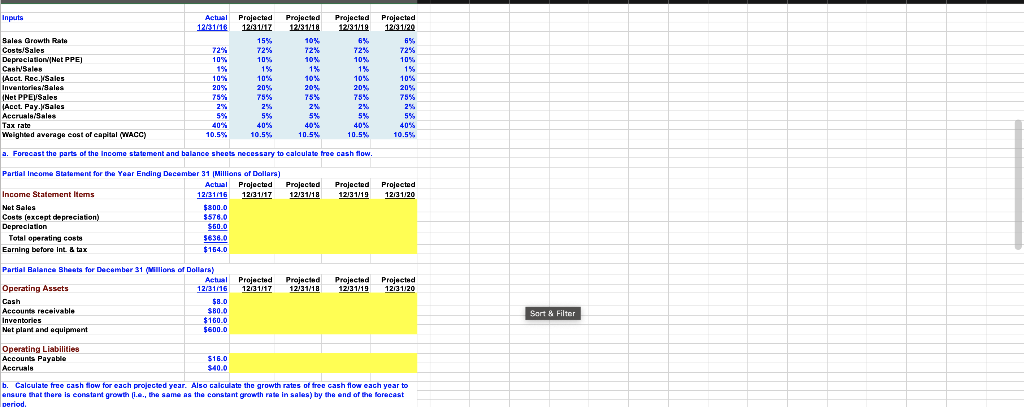
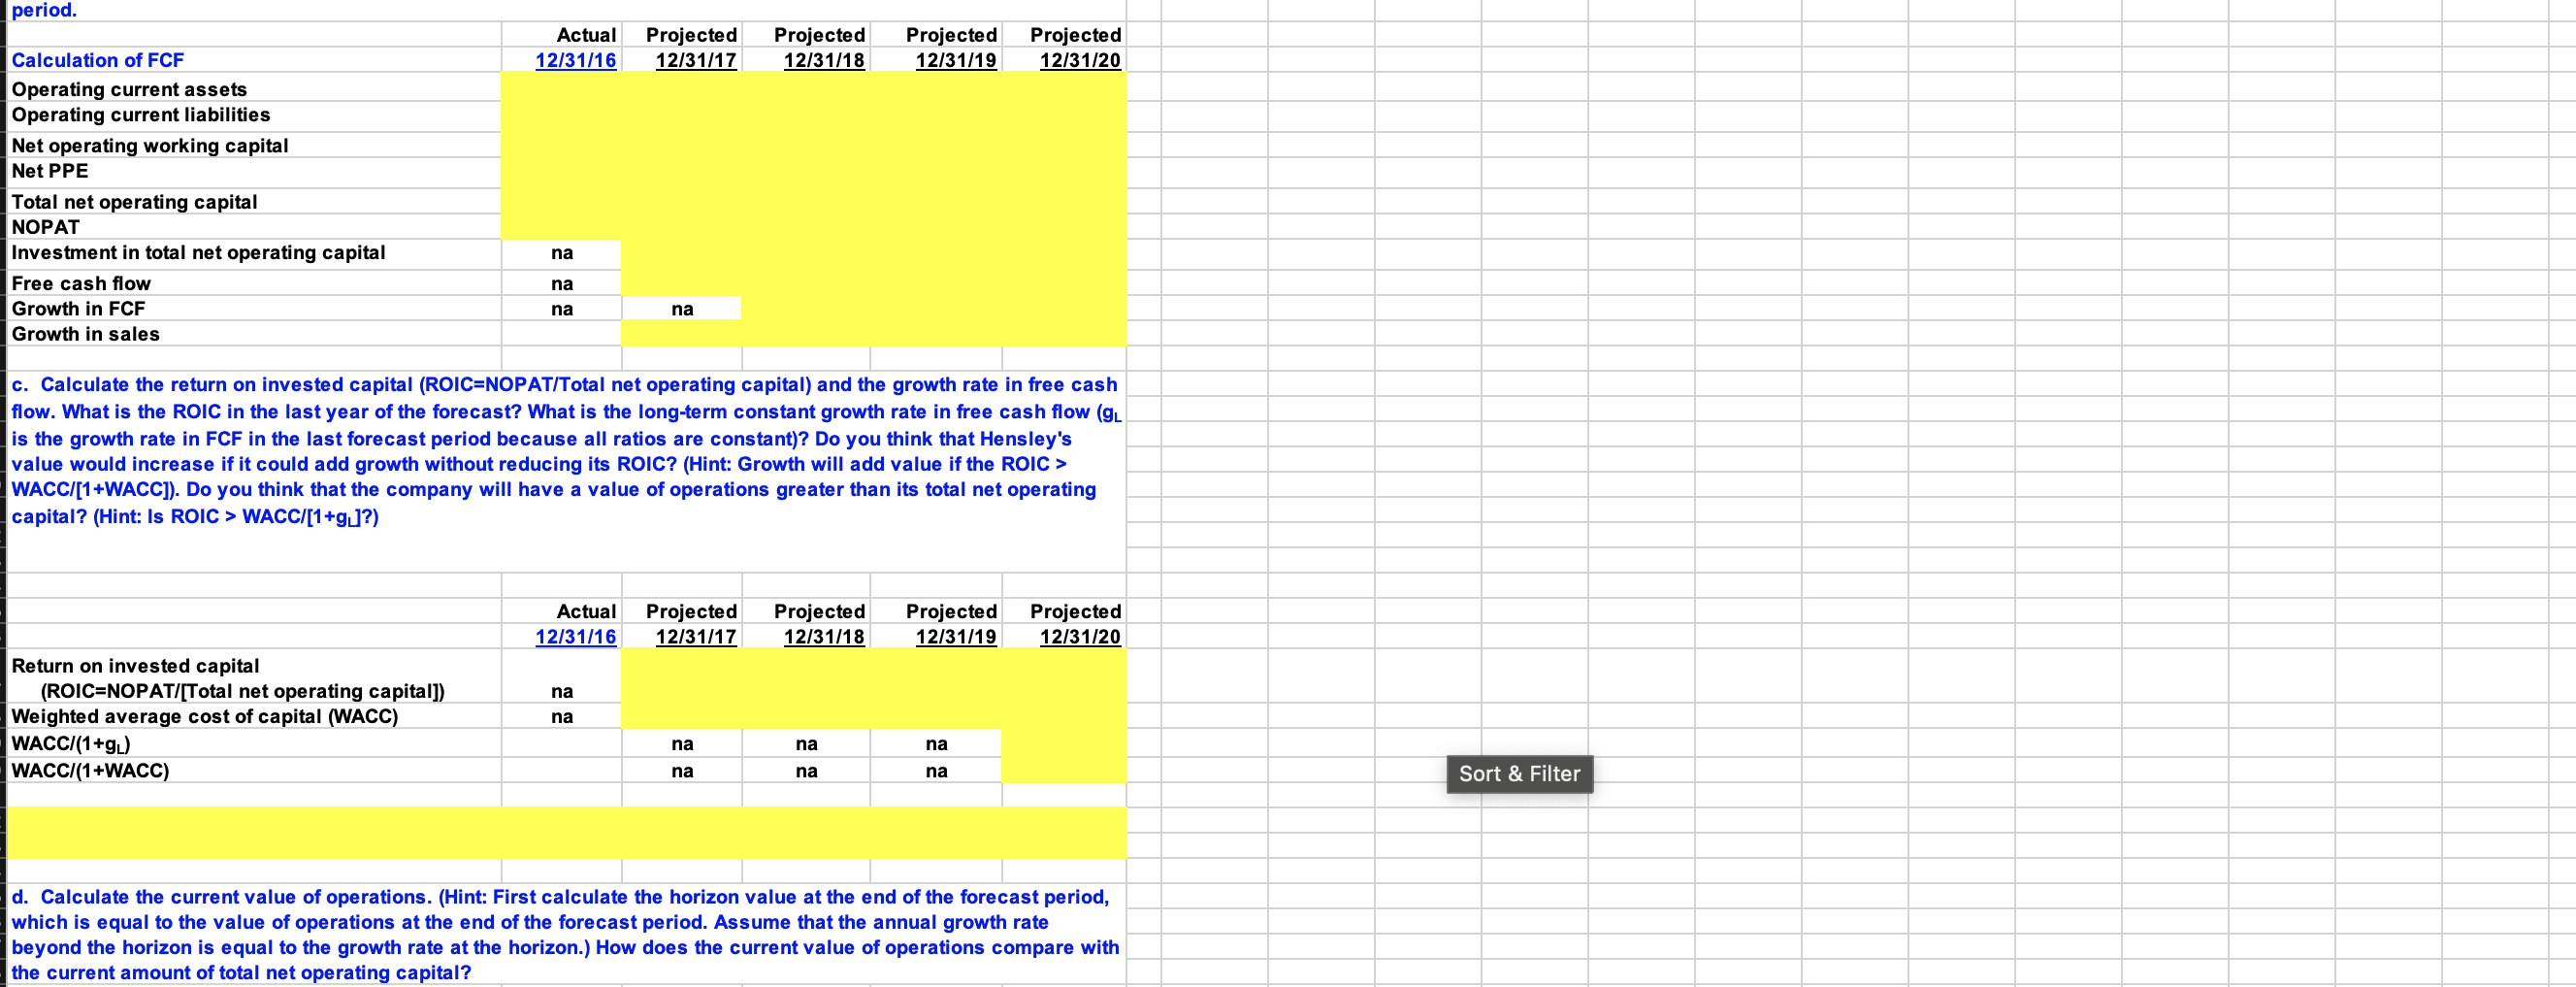
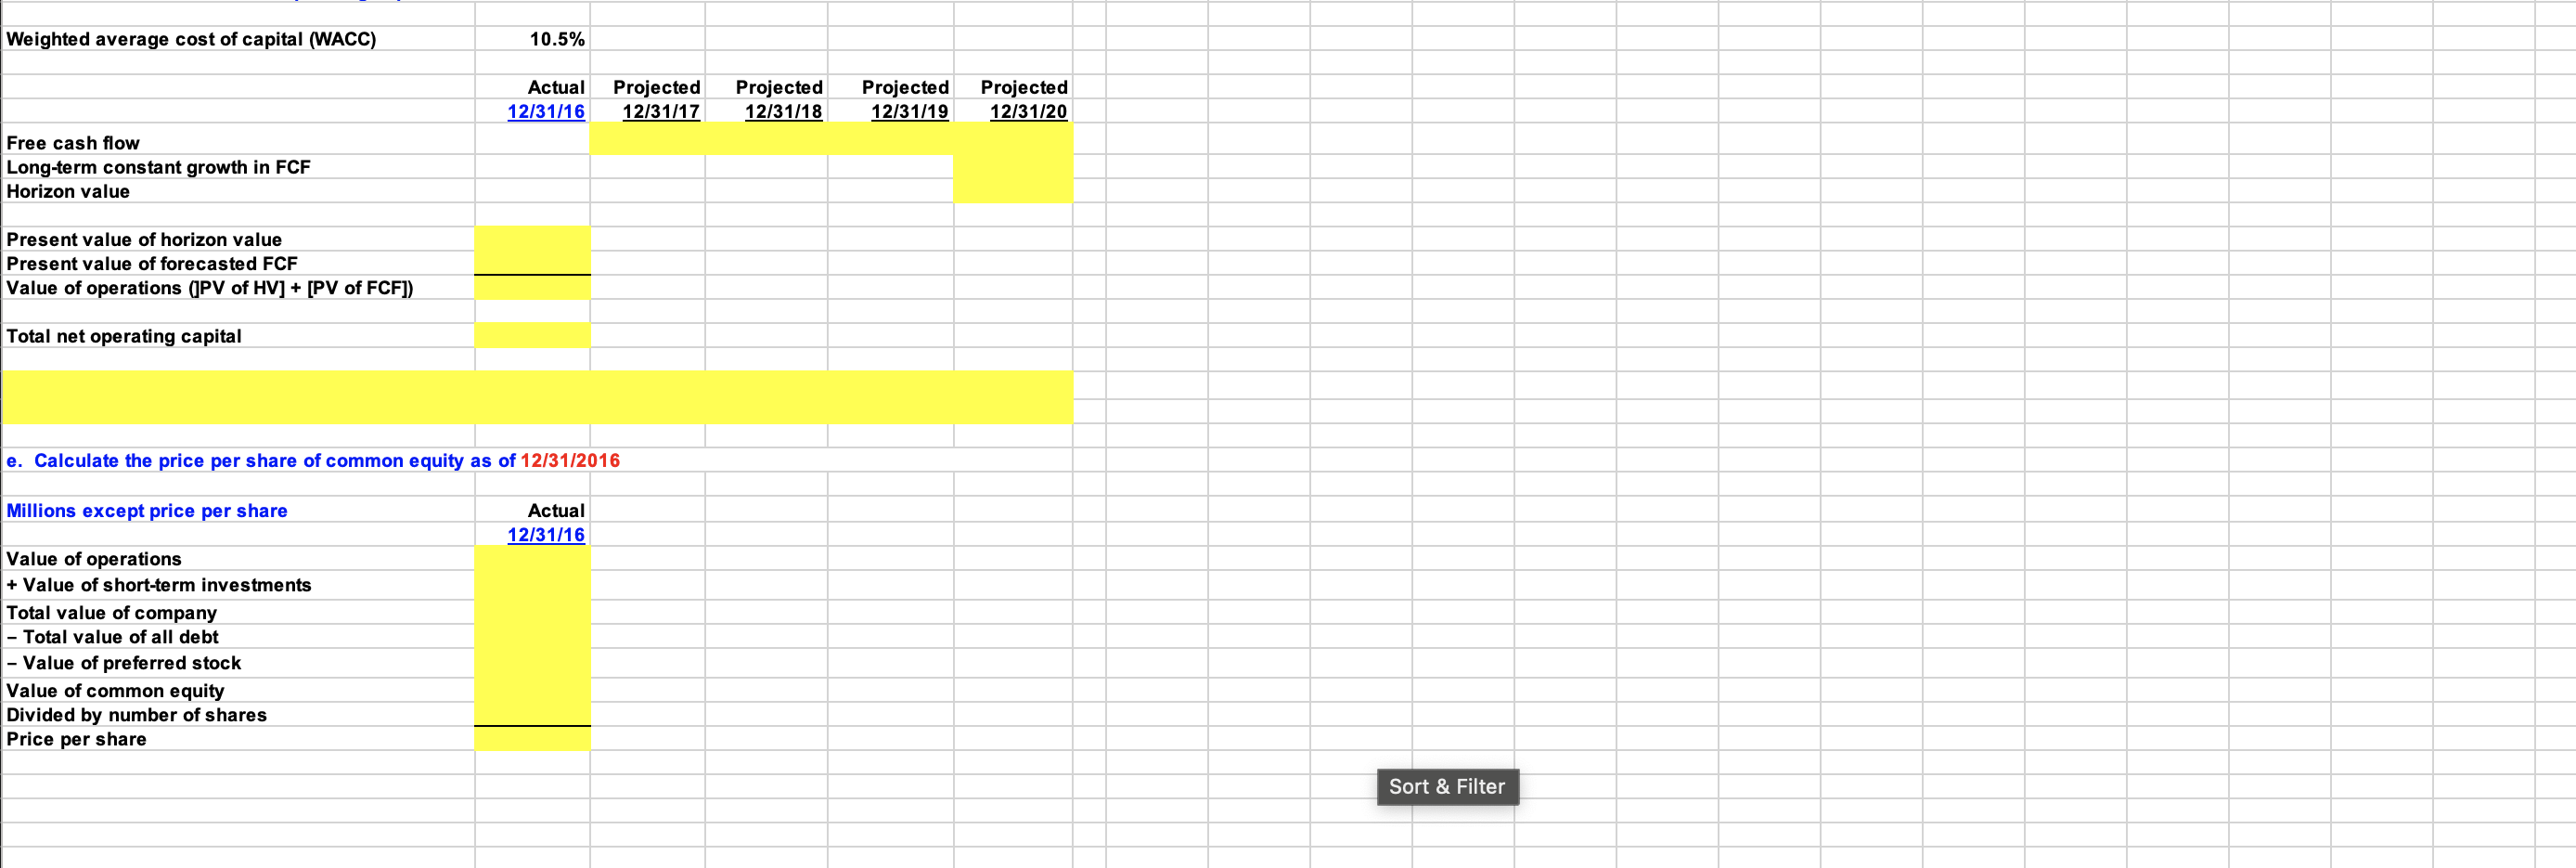
8/3/15 Chapter: Problem: 12 11 Start with the partial model in the file Ch12 P11 Build a Model.xlsx on the textbook's Website, which contains Henley Corporation's most recent financial statements. Use the following ratios and other selected information for the current and projected years to answer the next questions. Income Statement for the Year Ending December 31 (Millions Dollars) 2016 Net Sales $ 800.0 Costs fexcept depreciation) 5 5 576.0 Depreciation 5 60.0 Total operating costs $ 636.0 Eaming before Int & tax $ 164.0 Less interest $ 32.0 Earning before taxes $ $ 132.0 Taxes (40%) 5 52.8 Net income before prel. div. $ 79.2 Preferred div. $ 1.4 Net Income avail for com, div. $ 77.9 Common dividends $ 31.1 Addition to retained earnings 5 46.7 Number of shares in millions) Dividends per share 10 3.11 5 Balance Sheets for December 31 Millions of Dollars) Assets Cash $ Short-term Investments Accounts receivable Inventories Total current assets 5 5 Net plant and equipment 2016 8.0 20.0 80.0 160.0 268.0 600.0 Liabilities and Equity 2016 Accounts Payable $ 16.0 Notes payable 40.0 Accruals 40.0 Total current liabilities $ $ 96.0 Long-term bonds 300.0 Preferred stock $ 15.0 LOM SMER Par plus PIC) $ 257.0 Retained eamings 200.0 Common equity $ 457.0 Total liabilities and equity $868.0 Total Assets $ 868.0 Projected ratios and selected Information for the current and projected years are shown below. Inputs Projected 1201.29 Actual Projected 12031616 12031017 15% 72% 72% 10% 10%. % 1% 15% % 100% 10% 20% 20%. 75% 75% 2% 2% 5% 5% 40% 40% 10.5% 10.5% % Sales Growth Rata Costs/Sales Depreciation Net PPE) Chal Sales Acct. Rec.Sales Inventaries/sales (Net PPEVSales Acct. Pay. Sales Accruals/sales Tax rate Weighted average cost of capital (WACC) Projected 12/31/18 10% 72% 10% 1% 10% 20% % 75% 2% 5% 40% 10.5% Projected 12131412 6% 72% 10% 1% 1 10% 20% 75% 2%. 5% 40% 10.5% 72% 10% 1% 10% 20% 75% 2% 5% 40% 10.5%. a. Forecast the parts of the income statement and balance sheets necessary to calculate tree cash flow. Projected 12/31/19 Projected 12/31/20 Partial Income Statement for the Year Ending December 31 Millions of dollars) Actual Projected Projected Income Statement Items 12/31/16 12/31/17 12/31/18 Net Sales $800.0 Costs (except depreciation) $5780 Depreciation SGO.O Total operating costs $638.0 Earning before Int. & tax $164.0 Prajected 12/21/18 Projected Projected 12131/19 12/31/20 Partial Balance Sheets for December 31 (Millions of dollars) Actual Projected Operating Assets 12/31/16 12/31/17 Cash $8.0 Accounts receivable $80.0 Inventories $160.0 Net plant and equipment $600.0 Sort & Filter Operating Liabilities Accounts Payable $16.0 Accruale $40.0 b. Calculate free cash flow for each projected year. Also calculate the growth rates of tree cash flow each year to . ensure that there is constant growth (i..., the same as the constant growth rate in sales) by the end of the forecast period period. Actual 12/31/16 Projected 12/31/17 Projected 12/31/18 Projected 12/31/19 Projected 12/31/20 Calculation of FCF Operating current assets Operating current liabilities Net operating working capital Net PPE Total net operating capital NOPAT Investment in total net operating capital Free cash flow Growth in FCF Growth in sales na na na na c. Calculate the return on invested capital (ROIC=NOPAT/Total net operating capital) and the growth rate in free cash flow. What is the ROIC in the last year of the forecast? What is the long-term constant growth rate in free cash flow (g. is the growth rate in FCF in the last forecast period because all ratios are constant)? Do you think that Hensley's value would increase if it could add growth without reducing its ROIC? (Hint: Growth will add value if the ROIC > WACC/(1+WACC]). Do you think that the company will have a value of operations greater than its total net operating capital? (Hint: Is ROIC > WACCI[1+g_?) Actual 12/31/16 Projected 12/31/17 Projected 12/31/18 Projected 12/31/19 Projected 12/31/20 na Return on invested capital (ROIC=NOPAT/[Total net operating capital]) Weighted average cost of capital (WACC) WACCI(1+g.) WACCI(1+WACC) na na na na na na na Sort & Filter d. Calculate the current value of operations. (Hint: First calculate the horizon value at the end of the forecast period, which is equal to the value of operations at the end of the forecast period. Assume that the annual growth rate beyond the horizon is equal to the growth rate at the horizon.) How does the current value of operations compare with the current amount of total net operating capital? Weighted average cost of capital (WACC) 10.5% Actual 12/31/16 Projected 12/31/17 Projected 12/31/18 Projected 12/31/19 Projected 12/31/20 Free cash flow Long-term constant growth in FCF Horizon value Present value of horizon value Present value of forecasted FCF Value of operations (JPV of HV] + [PV of FCF]) Total net operating capital e. Calculate the price per share of common equity as of 12/31/2016 Millions except price per share Actual 12/31/16 Value of operations + Value of short-term investments Total value of company - Total value of all debt - Value of preferred stock Value of common equity Divided by number of shares Price per share Sort & Filter 8/3/15 Chapter: Problem: 12 11 Start with the partial model in the file Ch12 P11 Build a Model.xlsx on the textbook's Website, which contains Henley Corporation's most recent financial statements. Use the following ratios and other selected information for the current and projected years to answer the next questions. Income Statement for the Year Ending December 31 (Millions Dollars) 2016 Net Sales $ 800.0 Costs fexcept depreciation) 5 5 576.0 Depreciation 5 60.0 Total operating costs $ 636.0 Eaming before Int & tax $ 164.0 Less interest $ 32.0 Earning before taxes $ $ 132.0 Taxes (40%) 5 52.8 Net income before prel. div. $ 79.2 Preferred div. $ 1.4 Net Income avail for com, div. $ 77.9 Common dividends $ 31.1 Addition to retained earnings 5 46.7 Number of shares in millions) Dividends per share 10 3.11 5 Balance Sheets for December 31 Millions of Dollars) Assets Cash $ Short-term Investments Accounts receivable Inventories Total current assets 5 5 Net plant and equipment 2016 8.0 20.0 80.0 160.0 268.0 600.0 Liabilities and Equity 2016 Accounts Payable $ 16.0 Notes payable 40.0 Accruals 40.0 Total current liabilities $ $ 96.0 Long-term bonds 300.0 Preferred stock $ 15.0 LOM SMER Par plus PIC) $ 257.0 Retained eamings 200.0 Common equity $ 457.0 Total liabilities and equity $868.0 Total Assets $ 868.0 Projected ratios and selected Information for the current and projected years are shown below. Inputs Projected 1201.29 Actual Projected 12031616 12031017 15% 72% 72% 10% 10%. % 1% 15% % 100% 10% 20% 20%. 75% 75% 2% 2% 5% 5% 40% 40% 10.5% 10.5% % Sales Growth Rata Costs/Sales Depreciation Net PPE) Chal Sales Acct. Rec.Sales Inventaries/sales (Net PPEVSales Acct. Pay. Sales Accruals/sales Tax rate Weighted average cost of capital (WACC) Projected 12/31/18 10% 72% 10% 1% 10% 20% % 75% 2% 5% 40% 10.5% Projected 12131412 6% 72% 10% 1% 1 10% 20% 75% 2%. 5% 40% 10.5% 72% 10% 1% 10% 20% 75% 2% 5% 40% 10.5%. a. Forecast the parts of the income statement and balance sheets necessary to calculate tree cash flow. Projected 12/31/19 Projected 12/31/20 Partial Income Statement for the Year Ending December 31 Millions of dollars) Actual Projected Projected Income Statement Items 12/31/16 12/31/17 12/31/18 Net Sales $800.0 Costs (except depreciation) $5780 Depreciation SGO.O Total operating costs $638.0 Earning before Int. & tax $164.0 Prajected 12/21/18 Projected Projected 12131/19 12/31/20 Partial Balance Sheets for December 31 (Millions of dollars) Actual Projected Operating Assets 12/31/16 12/31/17 Cash $8.0 Accounts receivable $80.0 Inventories $160.0 Net plant and equipment $600.0 Sort & Filter Operating Liabilities Accounts Payable $16.0 Accruale $40.0 b. Calculate free cash flow for each projected year. Also calculate the growth rates of tree cash flow each year to . ensure that there is constant growth (i..., the same as the constant growth rate in sales) by the end of the forecast period period. Actual 12/31/16 Projected 12/31/17 Projected 12/31/18 Projected 12/31/19 Projected 12/31/20 Calculation of FCF Operating current assets Operating current liabilities Net operating working capital Net PPE Total net operating capital NOPAT Investment in total net operating capital Free cash flow Growth in FCF Growth in sales na na na na c. Calculate the return on invested capital (ROIC=NOPAT/Total net operating capital) and the growth rate in free cash flow. What is the ROIC in the last year of the forecast? What is the long-term constant growth rate in free cash flow (g. is the growth rate in FCF in the last forecast period because all ratios are constant)? Do you think that Hensley's value would increase if it could add growth without reducing its ROIC? (Hint: Growth will add value if the ROIC > WACC/(1+WACC]). Do you think that the company will have a value of operations greater than its total net operating capital? (Hint: Is ROIC > WACCI[1+g_?) Actual 12/31/16 Projected 12/31/17 Projected 12/31/18 Projected 12/31/19 Projected 12/31/20 na Return on invested capital (ROIC=NOPAT/[Total net operating capital]) Weighted average cost of capital (WACC) WACCI(1+g.) WACCI(1+WACC) na na na na na na na Sort & Filter d. Calculate the current value of operations. (Hint: First calculate the horizon value at the end of the forecast period, which is equal to the value of operations at the end of the forecast period. Assume that the annual growth rate beyond the horizon is equal to the growth rate at the horizon.) How does the current value of operations compare with the current amount of total net operating capital? Weighted average cost of capital (WACC) 10.5% Actual 12/31/16 Projected 12/31/17 Projected 12/31/18 Projected 12/31/19 Projected 12/31/20 Free cash flow Long-term constant growth in FCF Horizon value Present value of horizon value Present value of forecasted FCF Value of operations (JPV of HV] + [PV of FCF]) Total net operating capital e. Calculate the price per share of common equity as of 12/31/2016 Millions except price per share Actual 12/31/16 Value of operations + Value of short-term investments Total value of company - Total value of all debt - Value of preferred stock Value of common equity Divided by number of shares Price per share Sort & Filter
Step by Step Solution
There are 3 Steps involved in it

Get step-by-step solutions from verified subject matter experts