

Question: Please show how you worked out the solution if possible 1 2 Data Table 1 3 Month 4 January 5 February 6 March 7 April
Please show how you worked out the solution if possible
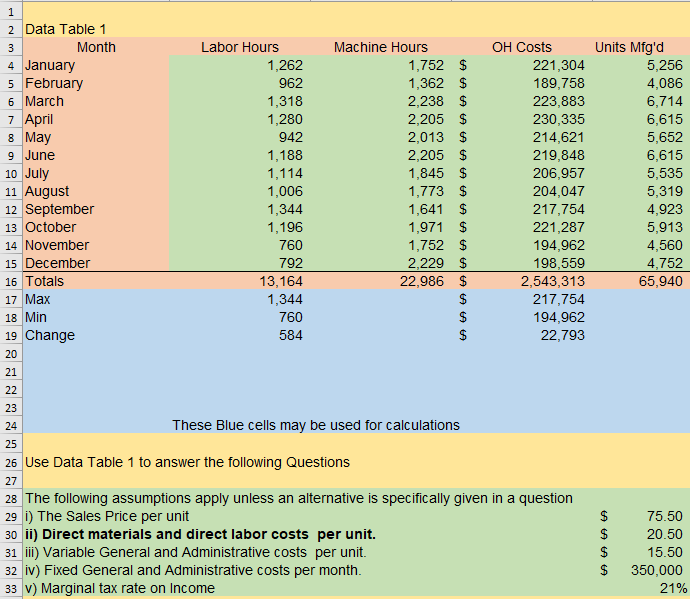
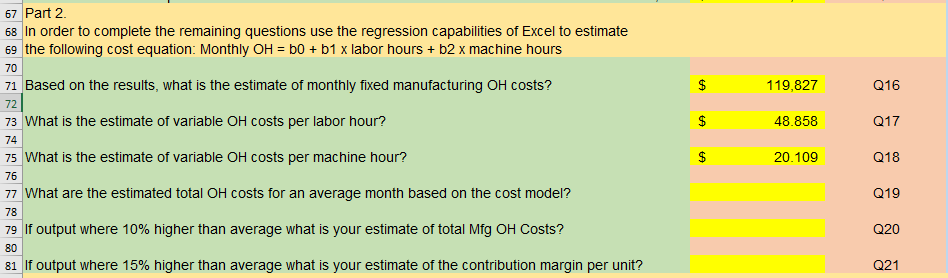
1 2 Data Table 1 3 Month 4 January 5 February 6 March 7 April 8 May 9 June 10 July 11 August 12 September 13 October 14 November 15 December 16 Totals 17 Max 18 Min 19 Change 20 21 22 Labor Hours 1,262 962 1,318 1,280 942 1,188 1,114 1,006 1,344 1,196 760 792 13,164 1,344 760 584 Machine Hours 1,752 $ 1,362 $ 2,238 $ 2,205 $ 2,013 $ 2,205 $ 1,845 $ 1,773 $ 1,641 $ 1,971 $ 1,752 $ 2,229 $ 22,986 $ $ $ $ OH Costs 221,304 189,758 223,883 230,335 214,621 219,848 206,957 204,047 217,754 221,287 194,962 198,559 2,543,313 217,754 194,962 22,793 Units Mfg'd 5,256 4,086 6,714 6,615 5,652 6,615 5,535 5,319 4,923 5,913 4,560 4,752 65,940 23 24 25 These Blue cells may be used for calculations 26 Use Data Table 1 to answer the following Questions 27 28 The following assumptions apply unless an alternative is specifically given in a question 29 i) The Sales Price per unit 30 ii) Direct materials and direct labor costs per unit. 31 ii) Variable General and Administrative costs per unit. 32 iv) Fixed General and Administrative costs per month. 33 v) Marginal tax rate on Income $ $ $ $ 75.50 20.50 15.50 350,000 21% 67 Part 2 68 In order to complete the remaining questions use the regression capabilities of Excel to estimate 69 the following cost equation: Monthly OH = b0 + b1 x labor hours + b2 x machine hours 70 71 Based on the results, what is the estimate of monthly fixed manufacturing OH costs? 119,827 Q16 72 $ $ $ 48.858 73 What is the estimate of variable OH costs per labor hour? 74 75 What is the estimate of variable OH costs per machine hour? 76 77 What are the estimated total OH costs for an average month based on the cost model? Q17 20.109 Q18 Q19 78 79 If output where 10% higher than average what is your estimate of total Mfg OH Costs? Q20 80 81 If output where 15% higher than average what is your estimate of the contribution margin per unit? Q21 1 2 Data Table 1 3 Month 4 January 5 February 6 March 7 April 8 May 9 June 10 July 11 August 12 September 13 October 14 November 15 December 16 Totals 17 Max 18 Min 19 Change 20 21 22 Labor Hours 1,262 962 1,318 1,280 942 1,188 1,114 1,006 1,344 1,196 760 792 13,164 1,344 760 584 Machine Hours 1,752 $ 1,362 $ 2,238 $ 2,205 $ 2,013 $ 2,205 $ 1,845 $ 1,773 $ 1,641 $ 1,971 $ 1,752 $ 2,229 $ 22,986 $ $ $ $ OH Costs 221,304 189,758 223,883 230,335 214,621 219,848 206,957 204,047 217,754 221,287 194,962 198,559 2,543,313 217,754 194,962 22,793 Units Mfg'd 5,256 4,086 6,714 6,615 5,652 6,615 5,535 5,319 4,923 5,913 4,560 4,752 65,940 23 24 25 These Blue cells may be used for calculations 26 Use Data Table 1 to answer the following Questions 27 28 The following assumptions apply unless an alternative is specifically given in a question 29 i) The Sales Price per unit 30 ii) Direct materials and direct labor costs per unit. 31 ii) Variable General and Administrative costs per unit. 32 iv) Fixed General and Administrative costs per month. 33 v) Marginal tax rate on Income $ $ $ $ 75.50 20.50 15.50 350,000 21% 67 Part 2 68 In order to complete the remaining questions use the regression capabilities of Excel to estimate 69 the following cost equation: Monthly OH = b0 + b1 x labor hours + b2 x machine hours 70 71 Based on the results, what is the estimate of monthly fixed manufacturing OH costs? 119,827 Q16 72 $ $ $ 48.858 73 What is the estimate of variable OH costs per labor hour? 74 75 What is the estimate of variable OH costs per machine hour? 76 77 What are the estimated total OH costs for an average month based on the cost model? Q17 20.109 Q18 Q19 78 79 If output where 10% higher than average what is your estimate of total Mfg OH Costs? Q20 80 81 If output where 15% higher than average what is your estimate of the contribution margin per unit? Q21
Step by Step Solution
There are 3 Steps involved in it

Get step-by-step solutions from verified subject matter experts