

Question: Please show in excel with formulas 1. The following two portfolios have a market value of $500 million. The bonds in both portfolios are trading
Please show in excel with formulas
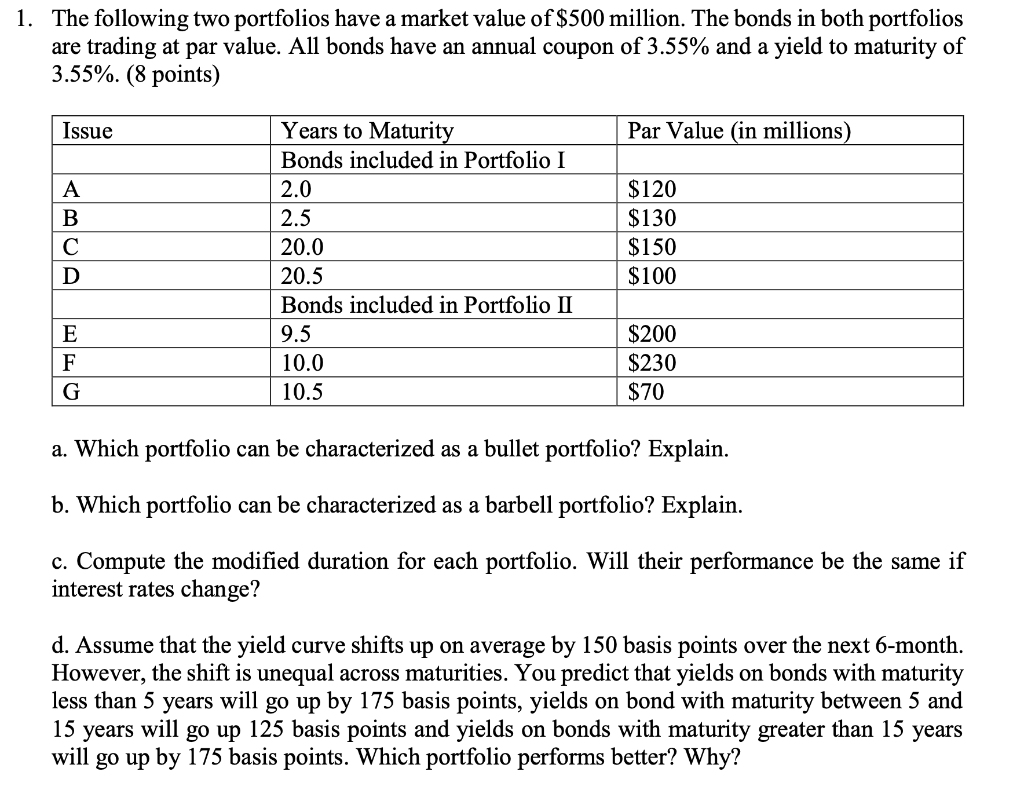
1. The following two portfolios have a market value of $500 million. The bonds in both portfolios are trading at par value. All bonds have an annual coupon of 3.55% and a yield to maturity of 3.55%. (8 points) Issue Par Value (in millions) A B Years to Maturity Bonds included in Portfolio I 2.0 2.5 20.0 20.5 Bonds included in Portfolio II 9.5 10.0 10.5 $120 $130 $150 $100 D E F G $200 $230 $70 a. Which portfolio can be characterized as a bullet portfolio? Explain. b. Which portfolio can be characterized as a barbell portfolio? Explain. c. Compute the modified duration for each portfolio. Will their performance be the same if interest rates change? d. Assume that the yield curve shifts up on average by 150 basis points over the next 6-month. However, the shift is unequal across maturities. You predict that yields on bonds with maturity less than 5 years will go up by 175 basis points, yields on bond with maturity between 5 and 15 years will go up 125 basis points and yields on bonds with maturity greater than 15 years will go up by 175 basis points. Which portfolio performs better? Why? 1. The following two portfolios have a market value of $500 million. The bonds in both portfolios are trading at par value. All bonds have an annual coupon of 3.55% and a yield to maturity of 3.55%. (8 points) Issue Par Value (in millions) A B Years to Maturity Bonds included in Portfolio I 2.0 2.5 20.0 20.5 Bonds included in Portfolio II 9.5 10.0 10.5 $120 $130 $150 $100 D E F G $200 $230 $70 a. Which portfolio can be characterized as a bullet portfolio? Explain. b. Which portfolio can be characterized as a barbell portfolio? Explain. c. Compute the modified duration for each portfolio. Will their performance be the same if interest rates change? d. Assume that the yield curve shifts up on average by 150 basis points over the next 6-month. However, the shift is unequal across maturities. You predict that yields on bonds with maturity less than 5 years will go up by 175 basis points, yields on bond with maturity between 5 and 15 years will go up 125 basis points and yields on bonds with maturity greater than 15 years will go up by 175 basis points. Which portfolio performs better? Why
Step by Step Solution
There are 3 Steps involved in it

Get step-by-step solutions from verified subject matter experts