

Question: Please show MATLAB code for this so that I understand how it's done. Thank you. I will give thumbs up. I tried using the Tsconst.m
Please show MATLAB code for this so that I understand how it's done. Thank you. I will give thumbs up. I tried using the Tsconst.m file but I'm not very good at MATLAB.
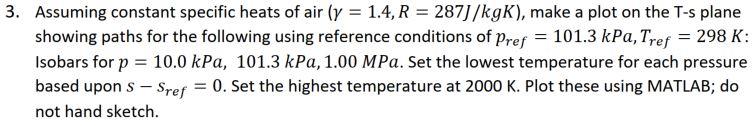
3. Assuming constant specific heats of air (y = 1.4, R = 287]/kgK), make a plot on the T-s plane showing paths for the following using reference conditions of Pref = 101.3 kPa, Tref = 298 K: Isobars for p = 10.0 kPa, 101.3 kPa, 1.00 MPa. Set the lowest temperature for each pressure based upon s - Sref 0. Set the highest temperature at 2000 K. Plot these using MATLAB; do not hand sketch. 3. Assuming constant specific heats of air (y = 1.4, R = 287]/kgK), make a plot on the T-s plane showing paths for the following using reference conditions of Pref = 101.3 kPa, Tref = 298 K: Isobars for p = 10.0 kPa, 101.3 kPa, 1.00 MPa. Set the lowest temperature for each pressure based upon s - Sref 0. Set the highest temperature at 2000 K. Plot these using MATLAB; do not hand sketch
Step by Step Solution
There are 3 Steps involved in it

Get step-by-step solutions from verified subject matter experts