

Question: please show matlab script and output please create 3 .m files using MATLAB following the 3 conditions a,b,c 2. (a) Assuming that data samples are
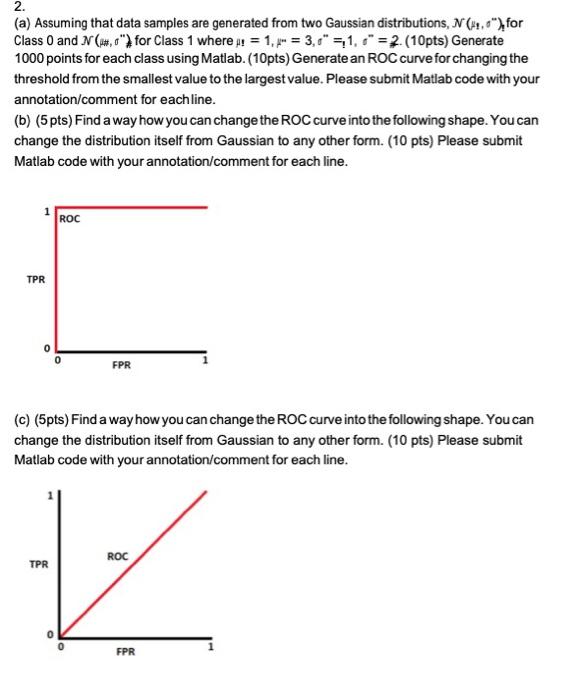
2. (a) Assuming that data samples are generated from two Gaussian distributions, N (12,1"), for Class and N (#,0") for Class 1 where ! = 1,4- = 3,1 51, 5 =2 (10pts) Generate 1000 points for each class using Matlab. (10pts) Generate an ROC curve for changing the threshold from the smallest value to the largest value. Please submit Matlab code with your annotation/comment for each line. (b) (5 pts) Find a way how you can change the ROC curve into the following shape. You can change the distribution itself from Gaussian to any other form. (10 pts) Please submit Matlab code with your annotation/comment for each line. ROC TPR FPR (c) (5pts) Find a way how you can change the ROC curve into the following shape. You can change the distribution itself from Gaussian to any other form. (10 pts) Please submit Matlab code with your annotation/comment for each line. TPR ROC FPR
Step by Step Solution
There are 3 Steps involved in it

Get step-by-step solutions from verified subject matter experts