

Question: Please show me how to do the math by hand and No Excel so I can learn please and thank you! :) Question 4: Introduction
Please show me how to do the math by hand and No Excel so I can learn please and thank you! :)
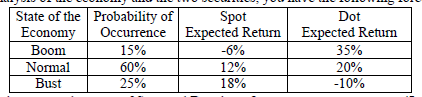
Question 4: Introduction to Risk and Return (i). Suppose you have $20,000 to invest in two securities: Spot and Dot. After you have done an extensive analysis of the economy and the two securities, you have the following forecasts:
a) What are the expected returns of Spot and Dot shares? b) What are the standard deviations of the returns on Spot and Dot? c) Estimate the covariance of the returns on Spot and Dot d) What is the correlation coefficient between Spot and Dot returns? e) What is the composition of the portfolio (weight of Spot and Dot) if you wish to have an expected return of 12 percent on the portfolio? f) Compute the standard deviation of the portfolio (in (e))
State of the Probability of Spot Economy Occurrence Expected Return Boom 15% -6% Normal 60% 12% Bust 25% 18% Dot Expected Return 35% 20% -10%
Step by Step Solution
There are 3 Steps involved in it

Get step-by-step solutions from verified subject matter experts