

Question: Please show me how to let Column 5 should allow for using cell formulas in the case of level production or direct input for mixed
Please show me how to let "Column 5 should allow for using cell formulas in the case of level production or direct input for mixed plans"
Does the Beginning Inventory of $400,000 need to be computed into thousand of labor hour? $400,000/(30*1000)=13.33 ?????
There is no information about No. of workers hired except for the Beginning No. of workers is 1900. No. of workers hired is what I need to find in the 2nd part of the question
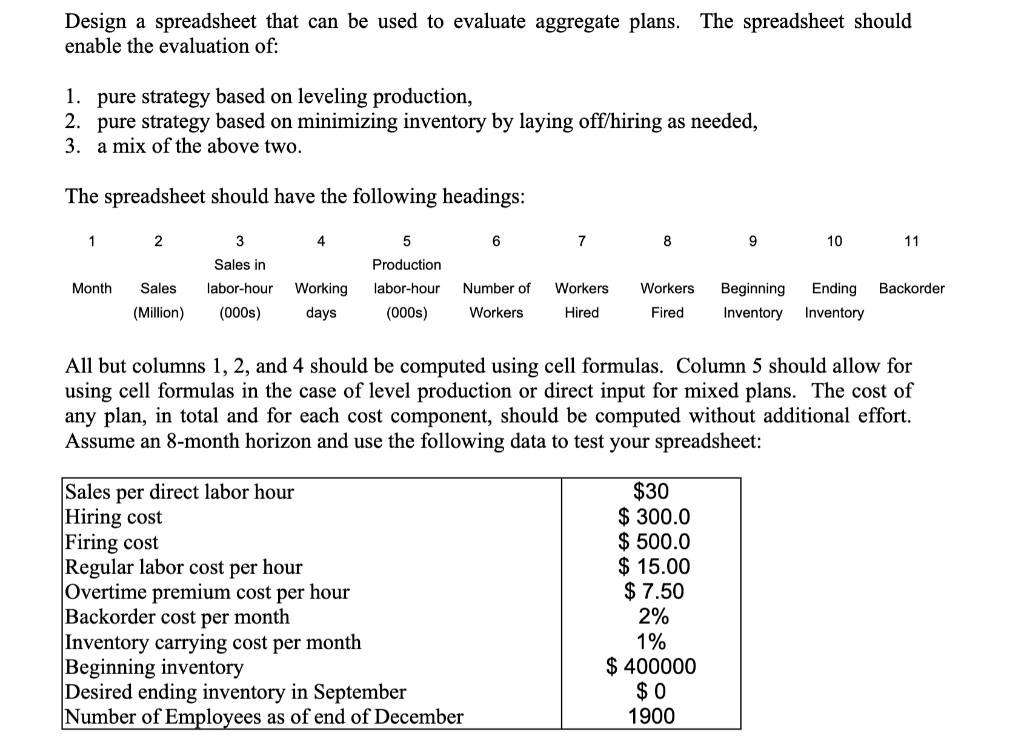
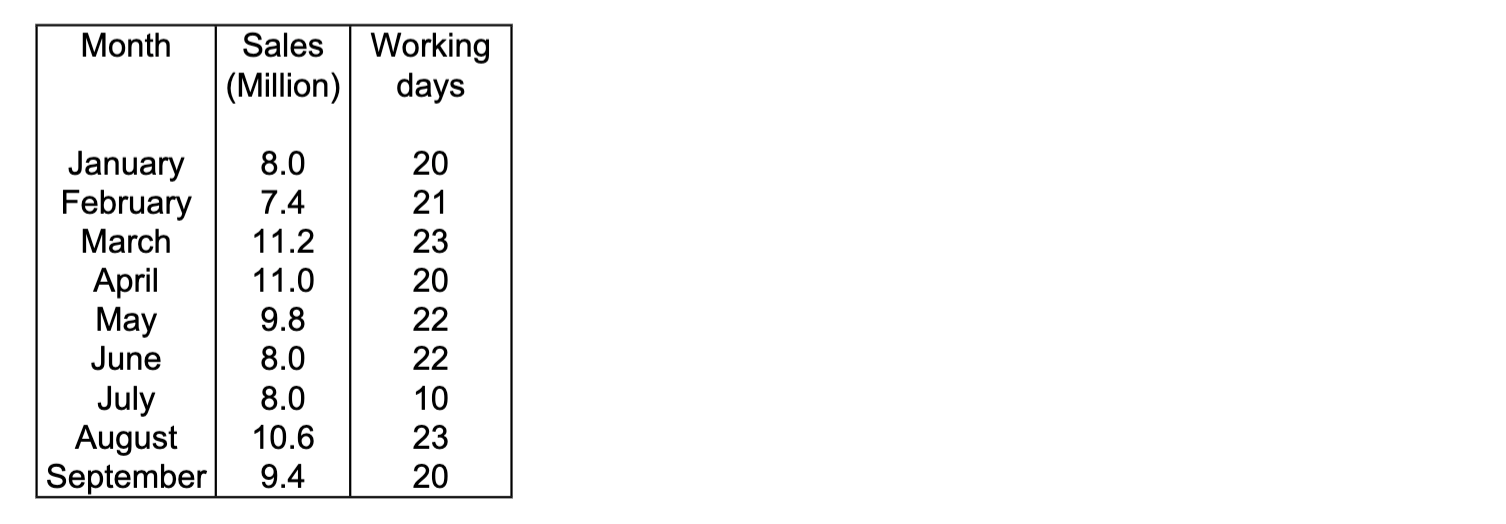
Design a spreadsheet that can be used to evaluate aggregate plans. The spreadsheet should enable the evaluation of: 1. pure strategy based on leveling production, 2. pure strategy based on minimizing inventory by laying off/hiring as needed, 3. a mix of the above two. The spreadsheet should have the following headings: 1 2 4 6 7 8 9 10 11 3 Sales in labor-hour (000) 5 Production labor-hour (000s) Month Backorder Sales (Million) Working days Number of Workers Workers Hired Workers Fired Beginning Inventory Ending Inventory All but columns 1, 2, and 4 should be computed using cell formulas. Column 5 should allow for using cell formulas in the case of level production or direct input for mixed plans. The cost of any plan, in total and for each cost component, should be computed without additional effort. Assume an 8-month horizon and use the following data to test your spreadsheet: Sales per direct labor hour Hiring cost Firing cost Regular labor cost per hour Overtime premium cost per hour Backorder cost per month Inventory carrying cost per month Beginning inventory Desired ending inventory in September Number of Employees as of end of December $30 $ 300.0 $ 500.0 $ 15.00 $ 7.50 2% 1% $ 400000 $ 0 1900 Month | Sales (Million) Working days 8.0 21 January February March April May June July August September 7.4 11.2 11.0 9.8 8.0 8.0 10.6 9.4 Design a spreadsheet that can be used to evaluate aggregate plans. The spreadsheet should enable the evaluation of: 1. pure strategy based on leveling production, 2. pure strategy based on minimizing inventory by laying off/hiring as needed, 3. a mix of the above two. The spreadsheet should have the following headings: 1 2 4 6 7 8 9 10 11 3 Sales in labor-hour (000) 5 Production labor-hour (000s) Month Backorder Sales (Million) Working days Number of Workers Workers Hired Workers Fired Beginning Inventory Ending Inventory All but columns 1, 2, and 4 should be computed using cell formulas. Column 5 should allow for using cell formulas in the case of level production or direct input for mixed plans. The cost of any plan, in total and for each cost component, should be computed without additional effort. Assume an 8-month horizon and use the following data to test your spreadsheet: Sales per direct labor hour Hiring cost Firing cost Regular labor cost per hour Overtime premium cost per hour Backorder cost per month Inventory carrying cost per month Beginning inventory Desired ending inventory in September Number of Employees as of end of December $30 $ 300.0 $ 500.0 $ 15.00 $ 7.50 2% 1% $ 400000 $ 0 1900 Month | Sales (Million) Working days 8.0 21 January February March April May June July August September 7.4 11.2 11.0 9.8 8.0 8.0 10.6 9.4
Step by Step Solution
There are 3 Steps involved in it

Get step-by-step solutions from verified subject matter experts