

Question: Please show me how to solve this on Excel, I cannot use the POM program to solve because I'm on a MAC. will upvote if
Please show me how to solve this on Excel, I cannot use the POM program to solve because I'm on a MAC. will upvote if helpful or comment if I dont understand something!
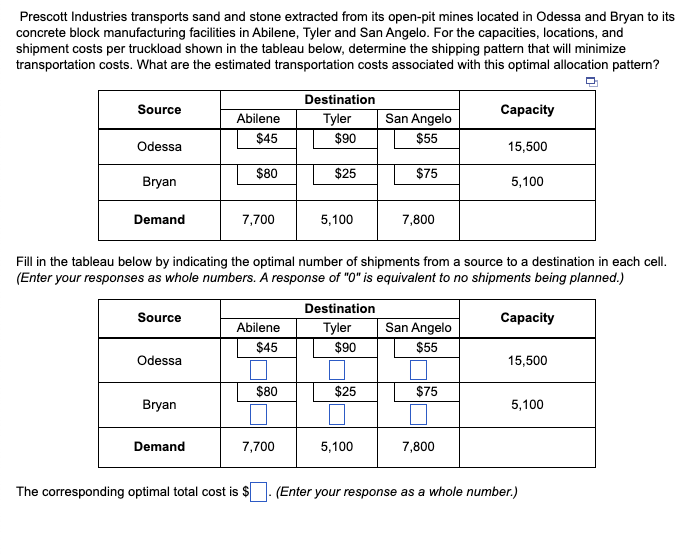
Source Abilene Tyler San Angelo Capacity Odessa $45 $90 $55 15,500 Bryan $80 $25 $75 5,100 Demand 7,700 5,100 7,800
Prescott Industries transports sand and stone extracted from its open-pit mines located in Odessa and Bryan to its concrete block manufacturing facilities in Abilene, Tyler and San Angelo. For the capacities, locations, and shipment costs per truckload shown the tableau below, determine the shipping pattern that will minimize transportation costs. What are the estimated transportation costs associated with this optimal allocation pattern? Source Destination Tyler $90 Abilene $45 Capacity San Angelo $55 Odessa 15,500 $80 $25 $75 Bryan 5,100 Demand 7,700 5,100 7,800 Fill in the tableau below by indicating the optimal number of shipments from a source to a destination in each cell. (Enter your responses as whole numbers. A response of "0" is equivalent to no shipments being planned.) Source Capacity Abilene $45 Destination Tyler $90 San Angelo $55 Odessa 15,500 $80 $25 $75 Bryan 5,100 Demand 7,700 5,100 7,800 The corresponding optimal total cost is $ (Enter your response as a whole number.)Step by Step Solution
There are 3 Steps involved in it
1 Expert Approved Answer
Step: 1 Unlock

Question Has Been Solved by an Expert!
Get step-by-step solutions from verified subject matter experts
Step: 2 Unlock
Step: 3 Unlock