

Question: Please show on Excel!! Create a Line chart for the sales data. Do observe any trend in the sales? If yes what is the trend.
Please show on Excel!! Create a Line chart for the sales data. Do observe any trend in the sales? If yes what is the trend. (Format the line chart so that only the 1st and 3rd quarter dates are visible on X-Axis ). Do you observe any seasonality? If yes, what is the frequency? Using the procedures detailed in the chapter, decompose the time series in to the trend, seasonality and irregular components.
According to the data given, would Holt-Winters Additive Seasonal Model or Holt-Winters Multiplicative Seasonal Model more appropriate to forecast Baskin Robbins sales. Justify your answer. Check figures: Quarter 3 normalized factor 1.12.
October 2010 CMA4 5669.88. There is a trend (long-term) moving upwards. There is also seasonality with higher numbers in quarters 1 and 4, representing the spring/summer months. Multiplicative model as seasonal peaks seem to be increasing.
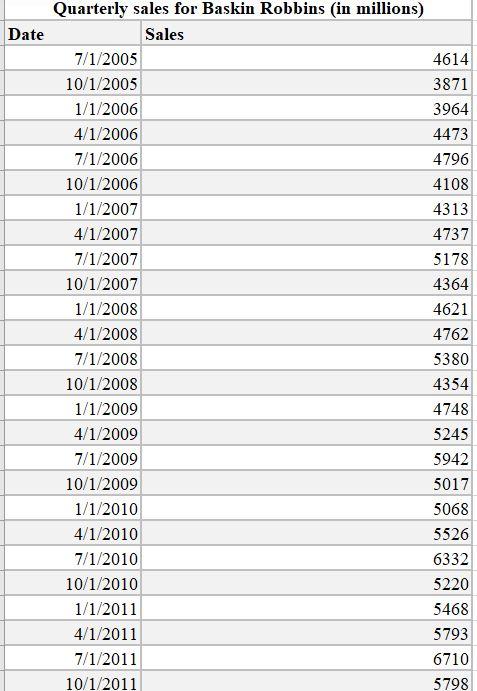
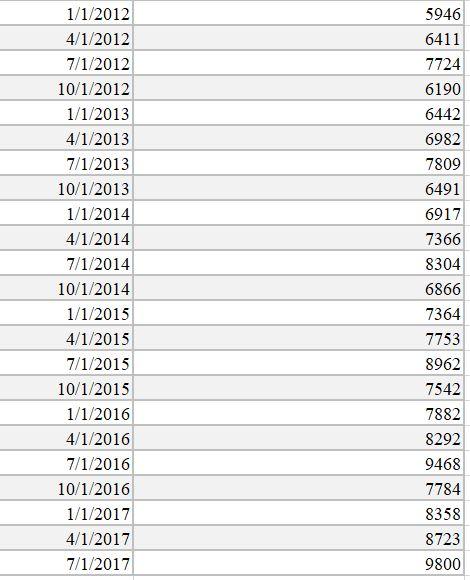
Quarterly sales for Baskin Robbins (in millions) \begin{tabular}{r|r|} \hline 1/1/2012 & 5946 \\ \hline 4/1/2012 & 6411 \\ \hline 7/1/2012 & 7724 \\ \hline 10/1/2012 & 6190 \\ \hline 1/1/2013 & 6442 \\ \hline 4/1/2013 & 6982 \\ \hline 7/1/2013 & 7809 \\ \hline 10/1/2013 & 6491 \\ \hline 1/1/2014 & 6917 \\ \hline 4/1/2014 & 7366 \\ \hline 7/1/2014 & 8304 \\ \hline 10/1/2014 & 6866 \\ \hline 1/1/2015 & 7364 \\ \hline 4/1/2015 & 7753 \\ \hline 7/1/2015 & 8962 \\ \hline 10/1/2015 & 7542 \\ \hline 1/1/2016 & 7882 \\ \hline 4/1/2016 & 8292 \\ \hline 7/1/2016 & 9468 \\ \hline 10/1/2016 & 7784 \\ \hline 1/1/2017 & 8358 \\ \hline 4/1/2017 & 8723 \\ \hline 7/1/2017 & 9800 \\ \hline \end{tabular} Quarterly sales for Baskin Robbins (in millions) \begin{tabular}{r|r|} \hline 1/1/2012 & 5946 \\ \hline 4/1/2012 & 6411 \\ \hline 7/1/2012 & 7724 \\ \hline 10/1/2012 & 6190 \\ \hline 1/1/2013 & 6442 \\ \hline 4/1/2013 & 6982 \\ \hline 7/1/2013 & 7809 \\ \hline 10/1/2013 & 6491 \\ \hline 1/1/2014 & 6917 \\ \hline 4/1/2014 & 7366 \\ \hline 7/1/2014 & 8304 \\ \hline 10/1/2014 & 6866 \\ \hline 1/1/2015 & 7364 \\ \hline 4/1/2015 & 7753 \\ \hline 7/1/2015 & 8962 \\ \hline 10/1/2015 & 7542 \\ \hline 1/1/2016 & 7882 \\ \hline 4/1/2016 & 8292 \\ \hline 7/1/2016 & 9468 \\ \hline 10/1/2016 & 7784 \\ \hline 1/1/2017 & 8358 \\ \hline 4/1/2017 & 8723 \\ \hline 7/1/2017 & 9800 \\ \hline \end{tabular}
Step by Step Solution
There are 3 Steps involved in it

Get step-by-step solutions from verified subject matter experts