

Question: please show references for formulas on how to do it on excel , thank you will give thumbs up. Monthly demand data for Flyra bicycles
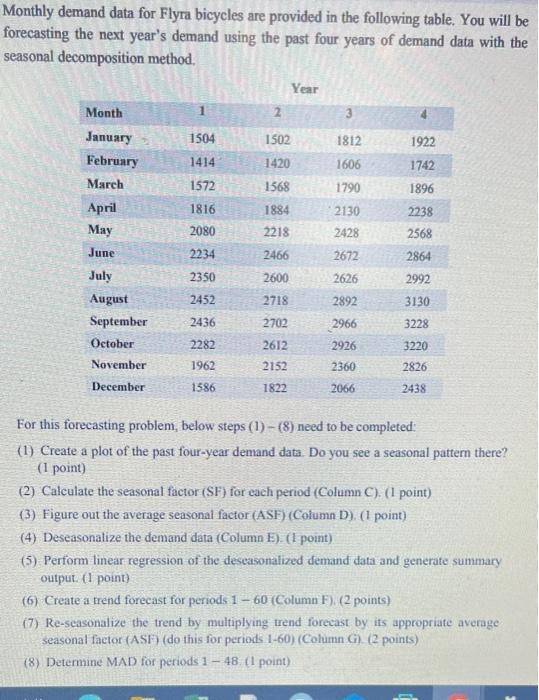
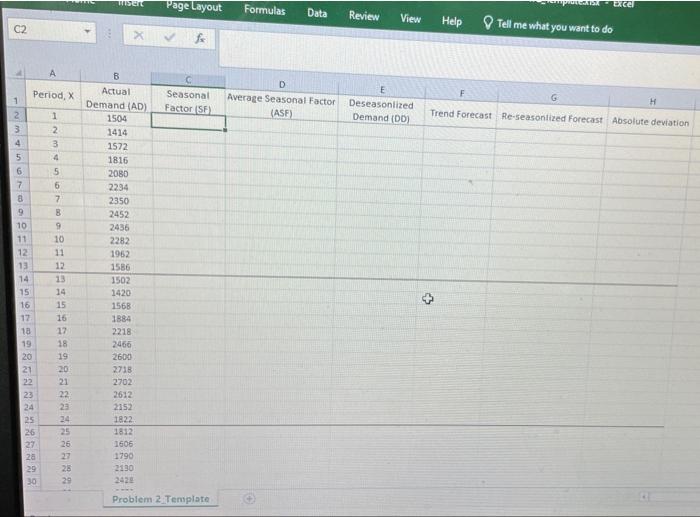
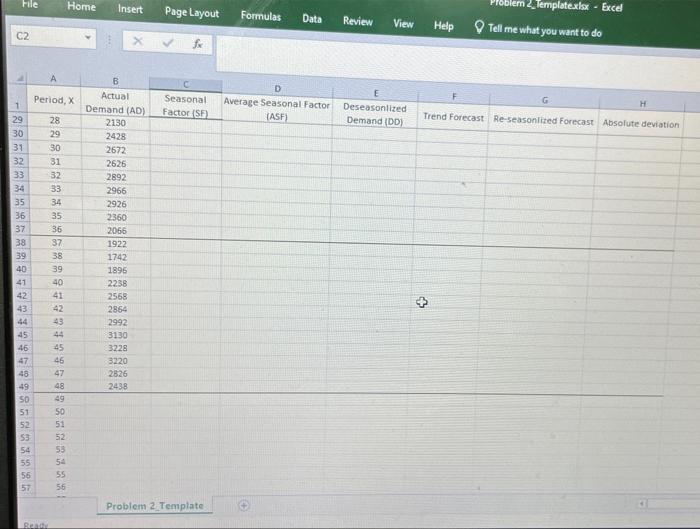
Monthly demand data for Flyra bicycles are provided in the following table. You will be forecasting the next year's demand using the past four years of demand data with the seasonal decomposition method. Year Month 3 January 1504 1502 1812 1922 February 1420 1606 1742 Mareh 1572 1896 April 2238 May 2080 2218 2672 1414 1568 1790 1816 1884 2130 2428 2568 June 2234 2466 2864 2350 2600 2626 2992 2452 2718 2892 3130 2436 2702 2966 3228 July August September October November December 2282 2612 2926 3220 1962 2152 2360 2826 1586 1822 2066 2438 For this forecasting problem, below steps (1) - (8) need to be completed: (1) Create a plot of the past four-year demand data. Do you see a seasonal pattern there? (1 point) (2) Calculate the seasonal factor (SF) for each period (Column C). (1 point) (3) Figure out the average seasonal factor (ASF) (Column D). (1 point) (4) Deseasonalize the demand data (Column E). (1 point) (5) Perform linear regression of the deseasonalized demand data and generate summary output (1 point) (6) Create a trend forecast for periods 1 - 60 (Column F) (2 points) (7) Re-scasonalize the trend by multiplying trend forecast by its appropriate average seasonal factor (ASF(do this for periods 1-60) (Column G) (2 points) (8) Determine MAD for periods 1 - 48. (1 point) Page Layout Excel Formulas Data Review View Help 02 Tell me what you want to do Period, X Seasonal Factor SF D Average Seasonal Factor (ASF) G H Deseasonized Demand (DD) Trend Forecast Re-seasonized Forecast Absolute deviation 2 3 4 5 1 2 3 4 5 10 11 13 14 15 16 Actual Demand (AD) 1504 1414 1572 1816 2080 2234 2350 2452 2436 2282 1952 1586 1502 1420 1568 1884 2218 2466 2600 2718 2702 2612 2152 1822 1812 1606 1790 2130 2429 6 7 8 9 10 11 12 13 14 15 16 12 18 19 20 21 22 23 24 25 26 27 28 29 30 + 18 19 20 9999999 22 25 26 27 29 Problem 2 Template File Home Insert 2 Template.xlsx - Excel Page Layout Formulas Data Review View Help Tell me what you want to do 62 Period, X Seasonal Factor SE H Average Seasonal Factor (ASF) Deseasonlized Demand (DD) Trend Forecast Re-seasonited Forecast Absolute deviation 29 30 31 32 33 34 35 36 37 38 39 40 41 42 43 44 45 46 47 48 49 SO 51 52 53 54 55 56 57 28 29 30 31 32 33 34 35 36 37 38 39 40 41 42 43 44 45 45 47 48 49 SO 51 B Actual Demand (AD) 2130 2428 2672 2626 2892 2966 2926 2360 2066 1922 1742 1895 2236 2558 2854 2992 3130 3228 3220 2826 2438 + 55 54 55 56 Problem 2 Template
Step by Step Solution
There are 3 Steps involved in it

Get step-by-step solutions from verified subject matter experts