

Question: Please show screenshots from excel Question IV (20 Points) The table below shows actual sales data during the last three years (12 quarters). Conduct a
Please show screenshots from excel
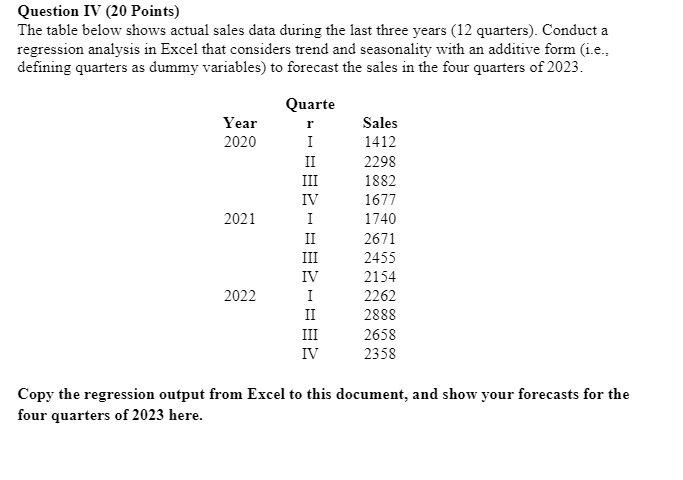
Question IV (20 Points) The table below shows actual sales data during the last three years (12 quarters). Conduct a regression analysis in Excel that considers trend and seasonality with an additive form (i.e., defining quarters as dummy variables) to forecast the sales in the four quarters of 2023. Copy the regression output from Excel to this document, and show your forecasts for the four quarters of 2023 here
Step by Step Solution
There are 3 Steps involved in it
1 Expert Approved Answer
Step: 1 Unlock

Question Has Been Solved by an Expert!
Get step-by-step solutions from verified subject matter experts
Step: 2 Unlock
Step: 3 Unlock