

Question: Please show step by step and detailed solution. 4.51 . DATA The table* gives automobile performance data for a few types of cars: Time (s)
Please show step by step and detailed solution.
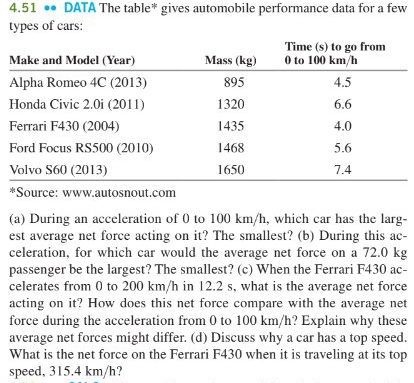
4.51 . DATA The table* gives automobile performance data for a few types of cars: Time (s) to go from Make and Model (Year) Mass (kg) 0 to 100 km/h Alpha Romeo 4C (2013) 895 4.5 Honda Civic 2.0i (2011) 1320 6.6 Ferrari F430 (2004) 1435 4.0 Ford Focus RS500 (2010) 1468 5.6 Volvo S60 (2013) 1650 7.4 *Source: www.autosnout.com (a) During an acceleration of 0 to 100 km/h, which car has the larg- est average net force acting on it? The smallest? (b) During this ac- celeration, for which car would the average net force on a 72.0 kg passenger be the largest? The smallest? (c) When the Ferrari F430 ac- celerates from 0 to 200 km/h in 12.2 s. what is the average net force acting on it? How does this net force compare with the average net force during the acceleration from 0 to 100 km/h? Explain why these average net forces might differ. (d) Discuss why a car has a top speed. What is the net force on the Ferrari F430 when it is traveling at its top speed, 315.4 km/h
Step by Step Solution
There are 3 Steps involved in it

Get step-by-step solutions from verified subject matter experts