

Question: Please show step by step on getting answers TABLE 8.2 The t Distribution APPENDIX B | Statistical Tables 53 The entries are values of r
Please show step by step on getting answers
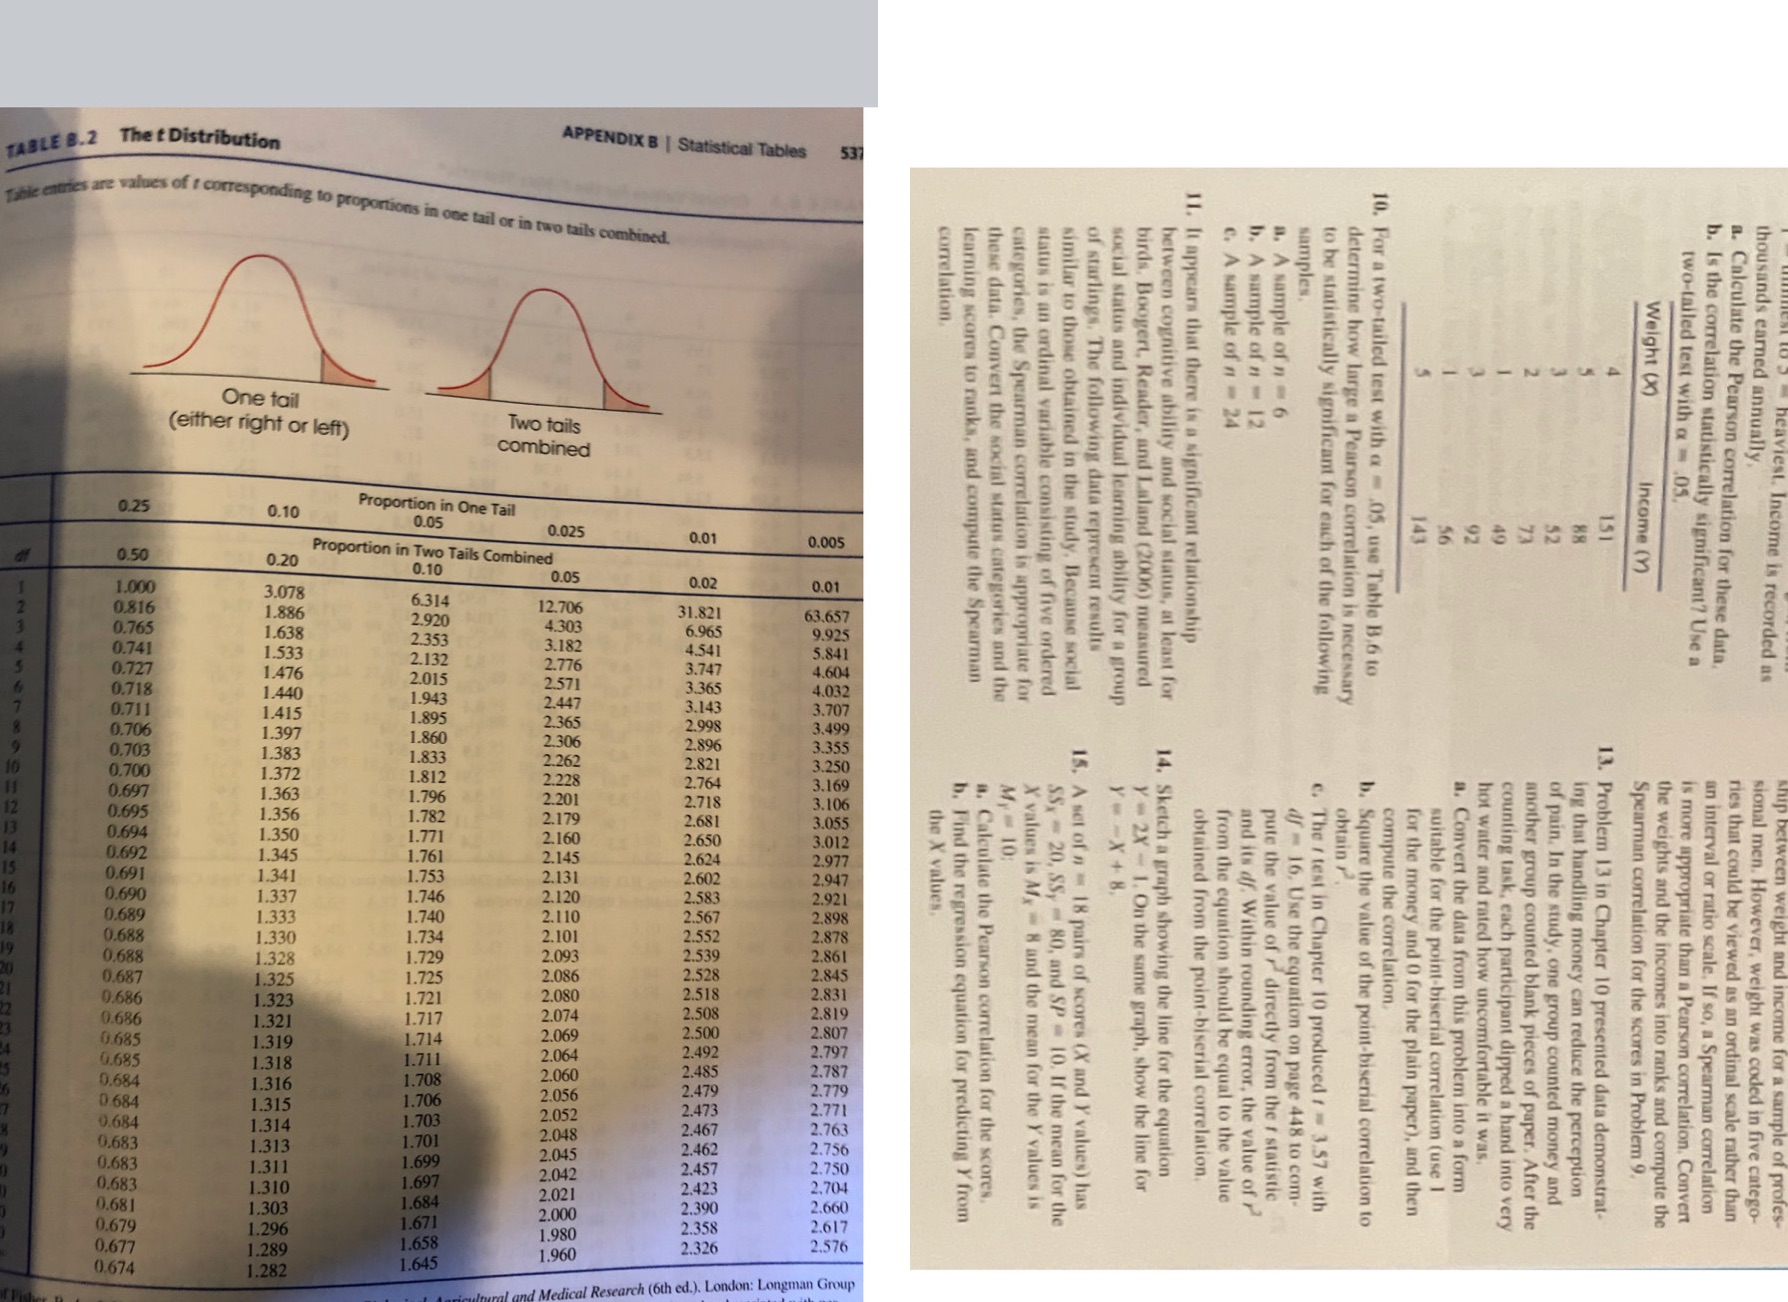
TABLE 8.2 The t Distribution APPENDIX B | Statistical Tables 53 The entries are values of r corresponding to proportions in one tail or in two tails combined. samples. correlation, a. A sample of n - 6 b. A sample of " - 12 C. A sample of n - 24 thousands earned annually, Weight () two-tailed test with a = 05. One tail 1 1. It appears that there is a significant relationship Two tails 10. For a two-tailed test with a - .05, use Table B.6 to a. Calculate the Pearson correlation for these data. b. Is the correlation statistically significant? Use a (either right or left) of starlings, The following data represent results combined learning scores to ranks, and compute the Spearman birds. Boogert, Reader, and Laland (2006) measured determine how large a Pearson correlation is necessary to be statistically significant for each of the following similar to those obtained in the study, Because social between cognitive ability and social status, at least for status is an ordinal variable consisting of five ordered categories, the Spearman correlation is appropriate for social status and individual learning ability for a group these data. Convert the social status categories and the Proportion in One Tail Income () ISI 26 88 0.25 EL 0.10 $2 0.05 0.025 0.01 0.005 0.50 0.20 Proportion in Two Tails Combined 0.10 0.05 0.02 0.01 1.000 3.078 is recorded as 6.314 0.816 1.886 12.706 31.821 63.657 2.920 4.303 9.925 0.765 1.638 6.965 2.353 3.182 4.541 0.741 1.533 5.841 2.132 2.776 3.747 4.604 0.727 1.476 2.015 2.571 3.365 4.032 0.718 1.440 1.943 2.447 3.143 3.707 0.711 1.415 1.895 2.365 2.998 3.499 0.706 1.397 1.860 2.306 2.896 3.355 0.703 1.383 1.833 2.262 2.821 3.250 0.700 1.372 1.812 2.228 2.764 3.169 0.697 1.363 1.796 2.201 2.718 3.106 0.695 1.356 1.782 2.179 2.681 3.055 101 = WV 2. 160 2.650 3.012 '8 +X-- obtain P. 0.694 1.350 1.771 the X values, 0.692 1.345 1.761 2.145 2.624 2.977 0.69 1.341 1.753 2.131 2.602 2.947 1.337 1.746 2.120 2.583 2.921 compute the correlation, 0.690 0.689 1.333 1.740 . 110 2.567 2.898 1.734 2.101 2.552 2.878 0.688 1.330 2.093 2.539 2.861 14. Sketch a graph showing the line for the equation hot water and rated how uncomfortable it was, 13. Problem 13 in Chapter 10 presented data demonstrat- Spearman correlation for the scores in Problem 9. 0.688 1.328 1.729 2.528 2.845 a. Convert the data from this problem into a form ing that handling money can reduce the perception Y - 2X - 1. On the same graph, show the line for 15, A set of n = 18 pairs of scores (X and Y values) has an interval or ratio scale, If so, a Spearman correlation 1.725 2.086 ries that could be viewed as an ordinal scale rather than of pain, In the study, one group counted money and sional men. However, weight was coded in five catego- the weights and the incomes into ranks and compute the is more appropriate than a Pearson correlation, Convert 0.687 suitable for the point-biserial correlation (use ] 1.325 obtained from the point-biserial correlation. 2.518 2.831 c. The / test in Chapter 10 produced ? = 3.57 with another group counted blank pieces of paper. After the a, Calculate the Pearson correlation for the scores, counting task, each participant dipped a hand into very b. Square the value of the point-biserial correlation to X values is My - 8 and the mean for the Y values is from the equation should be equal to the value pute the value of / directly from the f statistic for the money and 0 for the plain paper), and then 0.686 2.080 df - 16, Use the equation on page 448 to com- SSx - 20, SSy - 80, and SP = 10. If the mean for the b. Find the regression equation for predicting Y from and its of. Within rounding error, the value of r 1.323 1.721 2.074 2.508 2.819 0.686 1.321 1.717 2.069 2.500 2.807 0.685 1.319 1.714 1.711 2.064 2.492 2.797 0.685 1.318 2.787 1.316 1.708 2.060 2.485 D.684 2.479 2.779 D.684 1.706 2.056 1.315 2.052 2.473 2.771 0.684 1.314 1.703 2.763 2.048 2.467 0.683 1.313 1.701 2 045 2462 2.756 0.683 1.311 1.699 2042 2.457 2.750 1.310 1.697 2,704 0.683 2.021 2.423 0.681 1.303 1.684 2.390 2.660 2.000 1.671 2.358 2.617 0.679 1.296 1.980 0.677 1.289 1.658 1.960 2.326 2.576 0.674 1.282 1.645 al Research (6th ed.). London: Longman Group
Step by Step Solution
There are 3 Steps involved in it

Get step-by-step solutions from verified subject matter experts