

Question: Please show step by step solution it would be awesome if you send it in written format The Toronto Star once conducted a survey in
Please show step by step solution it would be awesome if you send it in written format
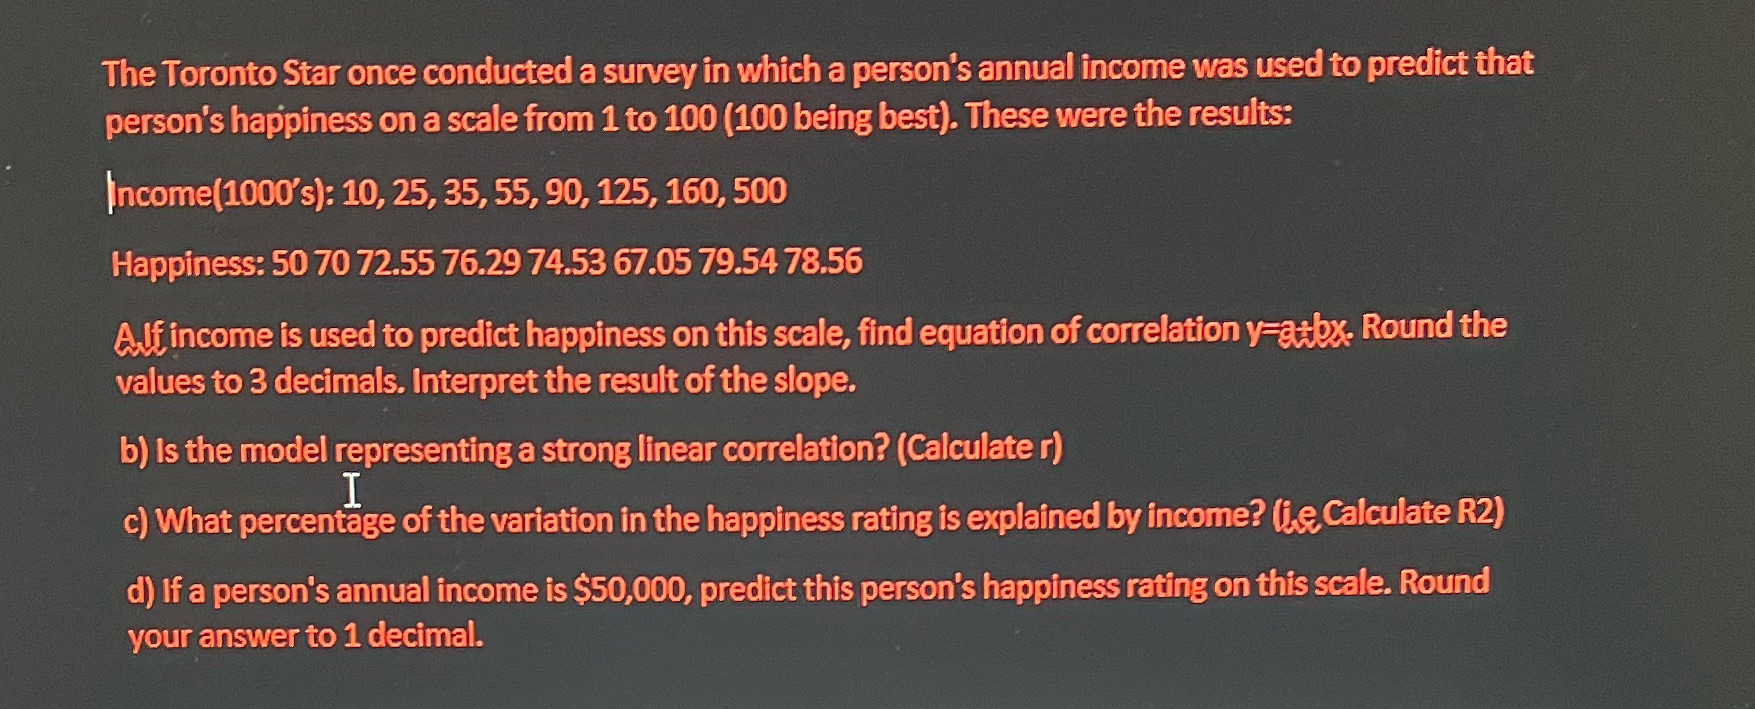
The Toronto Star once conducted a survey in which a person's annual income was used to predict that person's happiness on a scale from 1 to 100 (100 being best). These were the results: Income(1000's): 10, 25, 35, 55, 90, 125, 160, 500 Happiness: 50 70 72.55 76.29 74.53 67.05 79.54 78.56 Alf income is used to predict happiness on this scale, find equation of correlation y atbx. Round the values to 3 decimals. Interpret the result of the slope. b) Is the model representing a strong linear correlation? (Calculate r) I c) What percentage of the variation in the happiness rating is explained by income? (je Calculate R2) d) If a person's annual income is $50,000, predict this person's happiness rating on this scale. Round your answer to 1 decimal
Step by Step Solution
There are 3 Steps involved in it

Get step-by-step solutions from verified subject matter experts