

Question: Please show steps for how to solve in Excel The following table summarizes prices of various default-free zero-coupon bonds (expressed as a percentage of face
Please show steps for how to solve in Excel
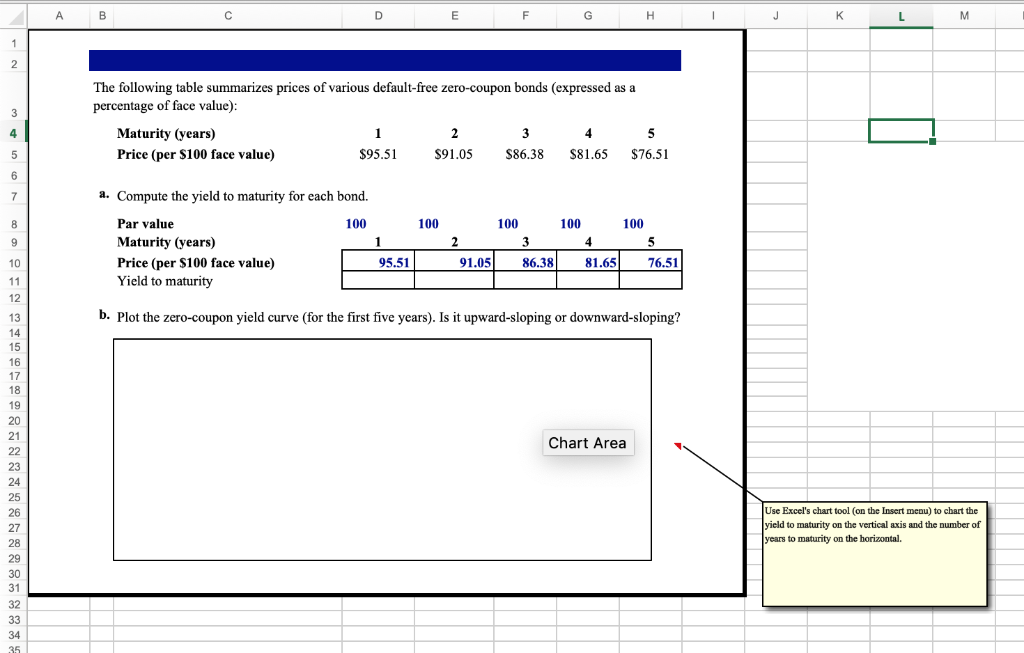
The following table summarizes prices of various default-free zero-coupon bonds (expressed as a percentage of face value) Maturity (years) Price (per S100 face value) 95.51 S91.05 S86.38 S81.65 $76.51 a. Compute the yield to maturity for each bond. Par value Maturity (years) Price (per S100 face value) Yield to maturity 100 100 100 100 100 10 95.51 91.05 86.38 81.65 76.51 12 b. Plot the zero-coupon yield curve (for the first five years). Is it upward-sloping or downward-sloping? 13 14 16 17 18 19 20 Chart Area 25 26 Use Excel's chart tool (on the Insert menu) to chart the yield to maturity on the vertical axis and the number of years to maturity on the horizontal
Step by Step Solution
There are 3 Steps involved in it

Get step-by-step solutions from verified subject matter experts