

Question: please show steps for the answers Ratio Analysis Self-Quiz Problem Using the financial statements for Bobcat Hospital in chapter 3, calculate the following ratios for
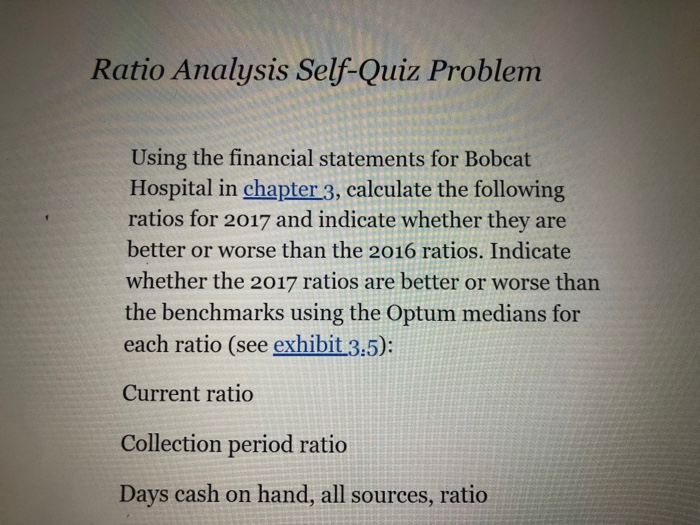
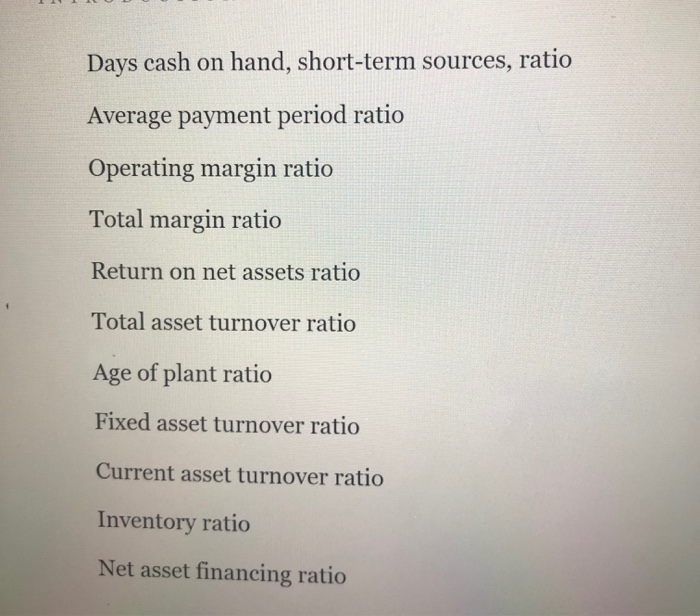
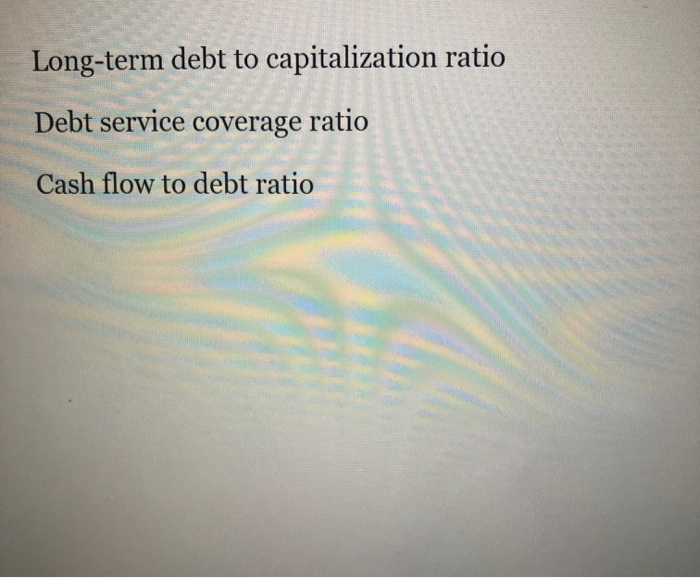
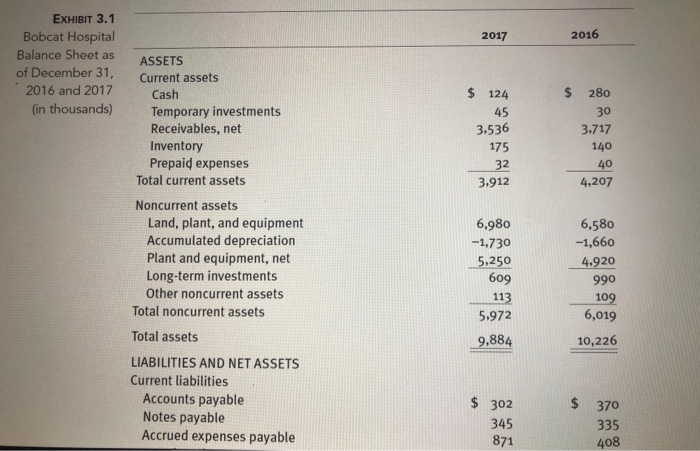
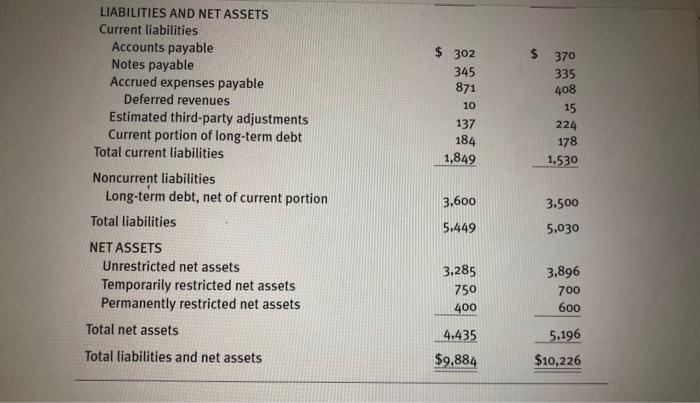
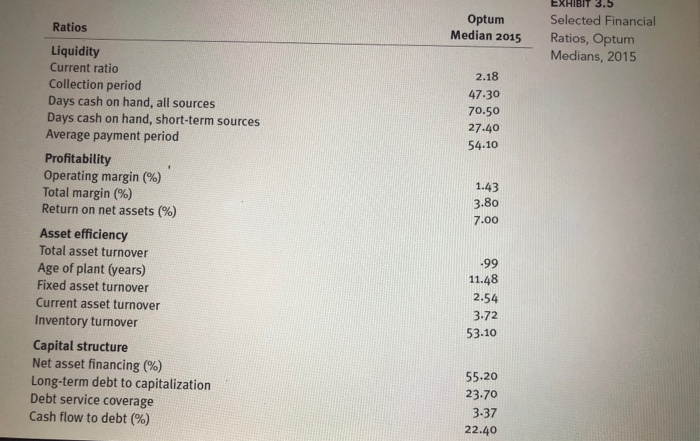
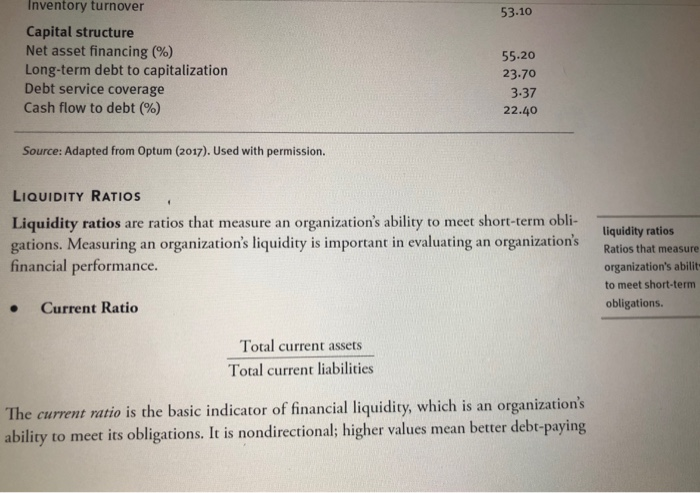
Ratio Analysis Self-Quiz Problem Using the financial statements for Bobcat Hospital in chapter 3, calculate the following ratios for 2017 and indicate whether they are better or worse than the 2016 ratios. Indicate whether the 2017 ratios are better or worse than the benchmarks using the Optum medians for each ratio (see exhibit 3:5): Current ratio Collection period ratio Days cash on hand, all sources, ratio Days cash on hand, short-term sources, ratio Average payment period ratio Operating margin ratio Total margin ratio Return on net assets ratio Total asset turnover ratio Age of plant ratio Fixed asset turnover ratio Current asset turnover ratio Inventory ratio Net asset financing ratio Long-term debt to capitalization ratio Debt service coverage ratio Cash flow to debt ratio 2017 2016 EXHIBIT 3.1 Bobcat Hospital Balance Sheet as of December 31, 2016 and 2017 (in thousands) $ 124 ASSETS Current assets Cash Temporary investments Receivables, net Inventory Prepaid expenses Total current assets Noncurrent assets Land, plant, and equipment Accumulated depreciation Plant and equipment, net Long-term investments Other noncurrent assets Total noncurrent assets 45 3,536 175 32 3.912 $ 280 30 3.717 140 40 4,207 6,980 -1,730 5,250 609 113 5,972 9,884 6,580 -1,660 4,920 990 109 6,019 Total assets 10,226 LIABILITIES AND NET ASSETS Current liabilities Accounts payable Notes payable Accrued expenses payable $ 302 $ 370 345 871 335 408 $ 302 345 871 LIABILITIES AND NET ASSETS Current liabilities Accounts payable Notes payable Accrued expenses payable Deferred revenues Estimated third-party adjustments Current portion of long-term debt Total current liabilities Noncurrent liabilities Long-term debt, net of current portion Total liabilities 10 137 $ 370 335 408 15 224 178 1,530 184 1,849 3,600 3.500 5,449 5,030 NET ASSETS Unrestricted net assets Temporarily restricted net assets Permanently restricted net assets Total net assets 3,285 750 400 3.896 700 600 Total liabilities and net assets 4,435 $9,884 5.196 $10,226 Ratios Optum Median 2015 Selected Financial Ratios, Optum Medians, 2015 2.18 47.30 70.50 27.40 54.10 + 1.43 3.80 7.00 Liquidity Current ratio Collection period Days cash on hand, all sources Days cash on hand, short-term sources Average payment period Profitability Operating margin (%) Total margin (%) Return on net assets (%) Asset efficiency Total asset turnover Age of plant (years) Fixed asset turnover Current asset turnover Inventory turnover Capital structure Net asset financing (%) Long-term debt to capitalization Debt service coverage Cash flow to debt (%) .99 11.48 2.54 3.72 53.10 55.20 23.70 3.37 22.40 Inventory turnover 53.10 Capital structure Net asset financing (%) Long-term debt to capitalization Debt service coverage Cash flow to debt (%) 55.20 23.70 3.37 22.40 Source: Adapted from Optum (2017). Used with permission. LIQUIDITY RATIOS Liquidity ratios are ratios that measure an organization's ability to meet short-term obli- gations. Measuring an organization's liquidity is important in evaluating an organization's financial performance. liquidity ratios Ratios that measure organization's abilit- to meet short-term obligations. Current Ratio Total current assets Total current liabilities The current ratio is the basic indicator of financial liquidity, which is an organization's ability to meet its obligations. It is nondirectional; higher values mean better debt-paying Ratio Analysis Self-Quiz Problem Using the financial statements for Bobcat Hospital in chapter 3, calculate the following ratios for 2017 and indicate whether they are better or worse than the 2016 ratios. Indicate whether the 2017 ratios are better or worse than the benchmarks using the Optum medians for each ratio (see exhibit 3:5): Current ratio Collection period ratio Days cash on hand, all sources, ratio Days cash on hand, short-term sources, ratio Average payment period ratio Operating margin ratio Total margin ratio Return on net assets ratio Total asset turnover ratio Age of plant ratio Fixed asset turnover ratio Current asset turnover ratio Inventory ratio Net asset financing ratio Long-term debt to capitalization ratio Debt service coverage ratio Cash flow to debt ratio 2017 2016 EXHIBIT 3.1 Bobcat Hospital Balance Sheet as of December 31, 2016 and 2017 (in thousands) $ 124 ASSETS Current assets Cash Temporary investments Receivables, net Inventory Prepaid expenses Total current assets Noncurrent assets Land, plant, and equipment Accumulated depreciation Plant and equipment, net Long-term investments Other noncurrent assets Total noncurrent assets 45 3,536 175 32 3.912 $ 280 30 3.717 140 40 4,207 6,980 -1,730 5,250 609 113 5,972 9,884 6,580 -1,660 4,920 990 109 6,019 Total assets 10,226 LIABILITIES AND NET ASSETS Current liabilities Accounts payable Notes payable Accrued expenses payable $ 302 $ 370 345 871 335 408 $ 302 345 871 LIABILITIES AND NET ASSETS Current liabilities Accounts payable Notes payable Accrued expenses payable Deferred revenues Estimated third-party adjustments Current portion of long-term debt Total current liabilities Noncurrent liabilities Long-term debt, net of current portion Total liabilities 10 137 $ 370 335 408 15 224 178 1,530 184 1,849 3,600 3.500 5,449 5,030 NET ASSETS Unrestricted net assets Temporarily restricted net assets Permanently restricted net assets Total net assets 3,285 750 400 3.896 700 600 Total liabilities and net assets 4,435 $9,884 5.196 $10,226 Ratios Optum Median 2015 Selected Financial Ratios, Optum Medians, 2015 2.18 47.30 70.50 27.40 54.10 + 1.43 3.80 7.00 Liquidity Current ratio Collection period Days cash on hand, all sources Days cash on hand, short-term sources Average payment period Profitability Operating margin (%) Total margin (%) Return on net assets (%) Asset efficiency Total asset turnover Age of plant (years) Fixed asset turnover Current asset turnover Inventory turnover Capital structure Net asset financing (%) Long-term debt to capitalization Debt service coverage Cash flow to debt (%) .99 11.48 2.54 3.72 53.10 55.20 23.70 3.37 22.40 Inventory turnover 53.10 Capital structure Net asset financing (%) Long-term debt to capitalization Debt service coverage Cash flow to debt (%) 55.20 23.70 3.37 22.40 Source: Adapted from Optum (2017). Used with permission. LIQUIDITY RATIOS Liquidity ratios are ratios that measure an organization's ability to meet short-term obli- gations. Measuring an organization's liquidity is important in evaluating an organization's financial performance. liquidity ratios Ratios that measure organization's abilit- to meet short-term obligations. Current Ratio Total current assets Total current liabilities The current ratio is the basic indicator of financial liquidity, which is an organization's ability to meet its obligations. It is nondirectional; higher values mean better debt-paying
Step by Step Solution
There are 3 Steps involved in it

Get step-by-step solutions from verified subject matter experts