

Question: please show steps on how it is done in excel displaying variables, objective function and constraints and solved using solver . Moyer Masonry Company produces
please show steps on how it is done in excel displaying variables, objective function and constraints and solved using solver 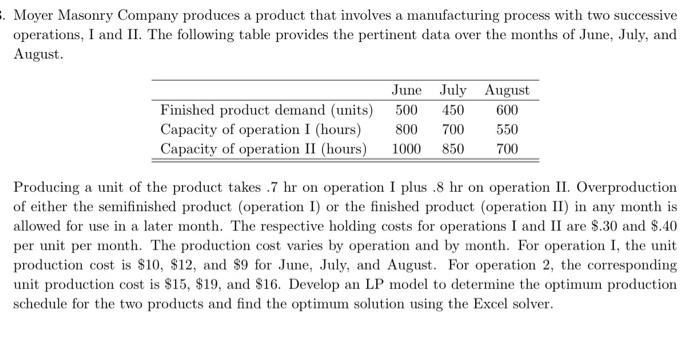
. Moyer Masonry Company produces a product that involves a manufacturing process with two successive operations, I and II. The following table provides the pertinent data over the months of June, July, and August. Finished product demand (units) Capacity of operation I (hours) Capacity of operation II (hours) June July August 500 450 600 800 700 550 1000 850 700 Producing a unit of the product takes 7 hr on operation I plus .8 hr on operation II. Overproduction of either the semifinished product (operation I) or the finished product (operation II) in any month is allowed for use in a later month. The respective holding costs for operations I and II are $.30 and $.40 per unit per month. The production cost varies by operation and by month. For operation I, the unit production cost is $10, $12, and $9 for June, July, and August. For operation 2, the corresponding unit production cost is $15, $19, and $16. Develop an LP model to determine the optimum production schedule for the two products and find the optimum solution using the Excel solver. . Moyer Masonry Company produces a product that involves a manufacturing process with two successive operations, I and II. The following table provides the pertinent data over the months of June, July, and August. Finished product demand (units) Capacity of operation I (hours) Capacity of operation II (hours) June July August 500 450 600 800 700 550 1000 850 700 Producing a unit of the product takes 7 hr on operation I plus .8 hr on operation II. Overproduction of either the semifinished product (operation I) or the finished product (operation II) in any month is allowed for use in a later month. The respective holding costs for operations I and II are $.30 and $.40 per unit per month. The production cost varies by operation and by month. For operation I, the unit production cost is $10, $12, and $9 for June, July, and August. For operation 2, the corresponding unit production cost is $15, $19, and $16. Develop an LP model to determine the optimum production schedule for the two products and find the optimum solution using the Excel solver
Step by Step Solution
There are 3 Steps involved in it
1 Expert Approved Answer
Step: 1 Unlock

Question Has Been Solved by an Expert!
Get step-by-step solutions from verified subject matter experts
Step: 2 Unlock
Step: 3 Unlock